

NQ, ES & Gold futures | Probability over opinion | ICT + backtests | TradingView indicators | https://xitter.cf/t.co/pruz2NQ6Tu | https://xitter.cf/t.co/7xIEUoPhSw
- Tweets19.7K
- Following233
- Followers13.7K
- Likes31.2K


ALT Herman Trading educational graphic showing a 62% short directional bias on NQ during the London session. An original TradingView replay screenshot accompanies the message that probability selects the trading side while confirmation determines the entry.

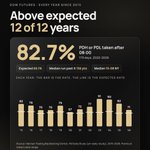
ALT Dark Herman Trading graphic in 4:5. Label: Dow futures, every year since 2015. Headline: Above expected 12 of 12 years. A large 82.7%: PDH or PDL taken after 08:00, 179 days, 2022-2026. Chips: Expected 66.1%, Median run past it 156 pts, Median 10:08 NY. A bar chart per year with a line for the expected rate: 2015 82, 2016 79, 2017 70, 2018 70, 2019 79, 2020 67, 2021 72, 2022 77, 2023 91, 2024 90, 2025 82, 2026 71 percent. Source: Herman Trading Backtesting Centre, YM Daily Study (ym-daily-study), 2015-2026. A Dow futures (YM) daily study from Herman Trading backtesting about previous day high and low liquidity.

ALT A wide light Herman Trading graphic in two cards. The left card shows NQ New York session 2015-2026, a large gold 59.4%, the text Monday: the lowest NY Expansion rate, n 539 Mondays, the question And the best day?, a gold Swipe button and www.hermantrading.pro. The right card, partly hidden in the feed, is a bar chart titled NY Expansion rate by weekday: Monday 59.4%, Tuesday 61.3%, Wednesday 63.7%, Thursday 60.7%, and Friday 65.9% marked in gold as best. Footer: NQ Session Study v2, 2015-2026, historical, not a forecast. Backtest statistics for NQ futures by session.

ALT Light Herman Trading graphic in 4:5 with deep gold accents. Label: Overnight low taken after 08:00. Headline: Overnight low taken, then in gold: 88.8% of 80 days. A white glass card lists two numbered checks at 08:00 ET: 1, yesterday took only the prior day's low; 2, London (02:00-07:59 ET) was bearish. Three bars follow: this setup 2022-2026 88.8% in gold, expected from distance alone 77.2%, this setup 2015-2021 75.9%. Footer: NQ Daily Study, 2015-2026. Herman Trading wordmark top left, NQ at 08:00 tag top right, www.hermantrading.pro at the bottom. A backtest of NQ futures showing how often New York takes the overnight low after these two conditions, compared with the rate distance alone predicts.

ALT Weather app style card titled NQ, New York: 7 red events next week. Stormy midweek: Fed Wednesday, GDP and Core PCE Thursday. Severe volatility watch: Thursday 8:30 AM ET GDP, Core PCE, personal income and spending, all at the same minute. Wednesday 2:00 PM ET Fed decision, press conference at 2:30. Five-day forecast for the week of Monday October 26, 2026, USD red folder news, Eastern time: Monday clear, 0 red. Tuesday showers, 1 red at 8:30 AM. Wednesday thunderstorms, 2 red at 2:00 and 2:30 PM. Thursday severe storms, 4 red at 8:30 AM. Friday clear, 0 red. Trump: no speech scheduled. Data from the TradingView economic calendar.

ALT Herman Trading card styled as a UK MOT test result. Headline: Would your trading pass its MOT? Vehicle: your trading, Sunday. Items: stop loss set before entry PASS; position size calculated, not guessed PASS; daily loss limit written down FAIL; news calendar checked for the week PASS; plan written for each setup FAIL; journal up to date ADVISORY. Result: FAIL, fix 2 items before Monday's open. A weekly pre-trading risk checklist.

ALT Herman Trading Weekly Receipt card. Headline: What one revenge spiral really costs. A paper receipt from Revenge Trading Co., example account at 1% risk per R, lists one planned trade stopped at -1.0R, revenge trade 1 at 2x size -2.0R, revenge trade 2 at 3x size -3.0R, and fees and slippage -0.3R. Planned loss -1.0R, emotional surcharge -5.3R, total -6.3R, about -6.3% at 1% risk per R. Footer: No refunds. Next time, stop after the first one.


ALT A smartphone lock screen held at a slight angle in front of a sunrise over a calm sea. The screen shows Friday, 23 October and the time 07:04 in large white numbers. Below the clock, a frosted glass widget titled "Income streams", marked "all running", lists six rows, each with a green status dot: Trading, Active; Whop, Live; three Online store rows, S1, S2 and S3, Live; Amazon KDP, Live. At the bottom of the screen: "Working while I sleep." A lifestyle picture of a trader with several income streams running alongside trading.

ALT Dark Herman Trading graphic in 4:5. Small label: New York vs the London range. Large headline: Stays inside London, then in gold: 0.5% of days. A dark glass card titled What New York does with the London range shows three bars: stays inside the London range 0.5% in gold, takes only one London side 52.9%, takes both London sides 46.6%. A chip below reads First London level taken, median 09:30 ET. Footer: NQ, 2,877 days, 2015-2026, NQ Session Study v2. Herman Trading wordmark top left, NQ sessions tag top right, www.hermantrading.pro at the bottom. It shows that on NQ futures the New York session almost never stays inside the London session range, a backtest of session liquidity for ICT and session traders.

ALT Herman Trading card styled as a UK parking penalty charge notice with a yellow header. Headline: You parked your stop in a no-loss zone. Notice HT-0001 lists vehicle: long 1 MNQ, location: your entry price, contravention: stop moved to breakeven before structure confirmed, observed: price tagged your entry, then ran to your target without you, discount: none. Penalty: the full 2R move you planned. A red ISSUED stamp. A lesson on moving the stop loss to breakeven too early on NQ futures.