

The industry-leading data newsletter documenting the story of the stock market. Also on Bloomberg Terminals. Join 200K+ investors.👇
- Tweets2.8K
- Following21
- Followers6.5K
- Likes9K
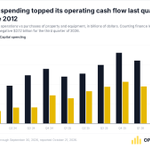





ALT Column chart of Meta's quarterly operating cash flow and capital spending, in billions of dollars, from the fourth quarter of 2023 through the third quarter of 2026. In the third quarter of 2026, capital spending of $33.94 billion topped operating cash flow of $32.79 billion, the first time since 2012.

ALT Western Digital's stock move in the first trading session after each of its last 8 earnings reports. It fell after the last 3, including drops of 10.1% in January 2026 and 13.0% in August 2026.

ALT Line chart of the 30-day correlation of daily returns since SpaceX's IPO. The black line, Tesla with SpaceX, rose from 0.10 in late July to 0.64 on October 21, its highest since SpaceX's IPO. The gray line, Tesla with the S&P 500, was 0.72 on October 21.


ALT Column chart of each stock's return from its IPO offer price to its close on trading day 90, counting the IPO day as day 1. Arm, which went public in 2023, was up 49.7%. Alibaba, 2014, was up 44.8%. SpaceX, 2026, was up 9.5%. Facebook, 2012, was down 46.6%.

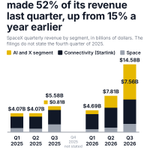
ALT Stacked column chart of SpaceX quarterly revenue by segment for the quarters its SEC filings break out. Total revenue was $4.07 billion in the first quarter of 2025, $4.07 billion in the second quarter of 2025, $5.58 billion in the third quarter of 2025, $4.69 billion in the first quarter of 2026, $7.81 billion in the second quarter of 2026 and $14.58 billion in the third quarter of 2026. The AI and X segment, which SpaceX reports as Super Intelligence and previously reported as AI, grew from $813 million in the third quarter of 2025 to $7.56 billion in the third quarter of 2026, 52% of revenue, up from 15% a year earlier. Connectivity, which includes Starlink, and Space make up the rest. The filings do not state the fourth quarter of 2025.

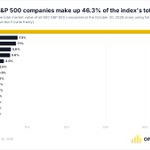
ALT Bar chart of the 15 largest S&P 500 companies' share of the index's total market value at the October 20, 2026 close. Nvidia was 7.5%, Apple 7.1%, Alphabet 5.8%, Microsoft 5.6% and Amazon 4.0%. Together the 15 made up 46.3%.

ALT Chart of how many S&P 500 stocks rose each trading day in 2026. On Tuesday, October 20, 404 rose, the most in a single day since 423 rose on April 8. On Monday, October 19, 176 rose.

ALT Line chart of SpaceX's daily closing price from its June 12, 2026 IPO through October 20. The stock closed at a record $201.80 on June 16, fell to a low close of $108.27 on August 5, below its $135 IPO price, and closed at $147.79 on October 20, 9.5% above the IPO price.


ALT Column chart of each stock's return from its IPO offer price to its close on trading day 90, counting the IPO day as day 1. Arm, which went public in 2023, was up 49.7%. Alibaba, 2014, was up 44.8%. SpaceX, 2026, was up 9.5%. Facebook, 2012, was down 46.6%.


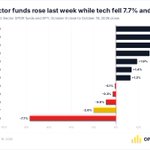
ALT Bar chart of last week's price change for the 11 Select Sector SPDR funds and SPY from October 9 to October 16, 2026. Consumer staples rose 5.0%, energy 4.9%, health care 3.5%, materials 3.0%, utilities 1.9%, financials 1.4% and real estate 1.3%. Communication services fell 0.1%, consumer discretionary 0.3% and industrials 0.9%. SPY fell 2.0% and technology fell 7.7%.

ALT Line chart of South Korea's Kospi index from December 30, 2025 to October 20, 2026. It rose from 4,214.17 to a record close of 9,114.55 on June 22, then fell to 5,552.74 on October 20, down 39% from the record. That was the lowest close since April 7, though the index is still up 31.8% this year.

ALT Bar chart of the Philadelphia Semiconductor Index's return 21 trading days after each of its seven previous losing streaks of eight days or more since May 1994. It was higher after July 1996 (12.0%) and September 2002 (12.2%) and lower after May 2002 (17.8% drop), May 2006 (5.3% drop), June 2006 (5.2% drop), January 2008 (4.0% drop) and October 2008 (12.9% drop). The median was a 5.2% drop, compared with a median 1.8% gain for all one-month periods since May 1994.

ALT Line chart of FINRA margin debt from January 2020 to September 2026. It rose to $1.48 trillion in September, second only to June's record of $1.50 trillion

ALT Line chart of the VanEck Semiconductor ETF's daily closes from September 22 to October 19, 2026. It rose 1.6% on October 19 after nine straight losses but gave back more than half of an intraday gain of 3.5%
