

Lost everything? So did I Rebuilding through God, discipline & purpose✝️ Trader | 10+ years in the market Free Technical Analysis, Price Action & Life Lessons📊
Joined November 2025
- Tweets20.5K
- Following297
- Followers838
- Likes21.2K



Pinned Tweet
Everyone sees the results.
Nobody saw this part.
There was a time I lost everything.
Living out of a suitcase.
Sharing one room with 14 people.
Sleeping on a bunk bed.
But still on the charts every night.
Not because it was comfortable,
but because I knew I couldn’t quit.
I knew where I went wrong.
I knew the potential I had.
And I trusted God to bring me through it.
This is where discipline was built.
This is why I say:
patience > pressure
consistency > emotion
This is where I decided I wasn’t going back.
What you see now didn’t start here.
God is good and glory to Him.
#RebuiltByGrace


Weekly Recap 📊
Solid week in the markets.
Not perfect,
but progress.
Pairs traded & results:
• USDCHF: +2,114.69
• USDJPY: +4,297.69
• EURNZD: +16,199.50
• CHFJPY: -937.13
• GBPJPY: +15,286.48
Total for the week:
+$36,961.23 USD💰
Not every trade was clean.
Not every decision was perfect.
But the difference now?
I don’t chase.
I don’t force.
I don’t revenge trade.
This week was built on:
• Discipline when I wanted to overtrade
• Patience when nothing was there
• Execution when it mattered
• Walking away when I should
That’s the real edge.
Not the setup but the self-control.
A few months ago, I would’ve given it all back because of greed and wanting to make more.
This time?
I kept it.
That’s real growth.
Now I’m off the charts enjoying a lovely sunset.
Time to
Reset, Reflect, Journal, Pray, Recharge.
Because next week,
we go again, but sharper.
May is personal and about to be better.
#RebuiltByGrace #Trading #Forex #Discipline #Progress

🚨 $ASTS HAS PLUNGED OVER 56% SINCE I FLAGGED THIS BEARISH SETUP IN SEPTEMBER AND WENT SHORT.
1 September: $59.10
Today: $25.55 📉
I identified:
• Double top around $130
• Critical neckline at $51
• Rising trendline at risk
• Potential downside towards $37
LOOK AT PRICE TODAY👀
The trendline BROKE.
The neckline BROKE.
Even the $37 support BROKE.
While many were looking for buying opportunities I was focused on MARKET STRUCTURE.
This is why understanding PRICE ACTION matters.
STOP GUESSING.
START READING PRICE.
Would you buy $ASTS here or wait for confirmation of a reversal?


$ASTS double topped nicely at 130.00 and reversed as expected.
Now it’s approaching the neckline of the double top at 51.00 and once it breaks that trend line, as well as the support at 51.00 then it can make its way to 37.00 which will see the double top play out. Now THAT will be a FANTASTIC area to buy if it then holds 👀

1
257
🚨 THEY LAUGHED AT MY $IREN ANALYSIS TOO AND CALLED IT RIDICULOUS 👀
19 October: $26.99
Today: $14.41 📉
I flagged the breakdown below $34 support and a potential drop towards $15.
LOOK AT PRICE NOW 👀
The $15 target has been reached, with price now testing that major support zone.
While many were focused on buying I was focused on MARKET STRUCTURE and went short.
The next question?
Will buyers defend $15 or will the selling continue and break lower?
STOP GUESSING.
START READING PRICE.
Who’s watching $IREN at this key level? 👇🏾


$IREN broke below the 34.00 support level and will possibly head to 15.00 that support level which was untouched. Then from there it can find buyers and recover from there.

📌 HERE’S THE LESSON.
The warning signs were there:
• Major support at $34 broke.
• Bearish momentum accelerated.
• The next key support was around $15.
• Price followed the bearish structure.
Now that $15 has been reached, I’m watching for confirmation of a reversal or continuation, NOT blindly buying.
PRICE ACTION ISN’T ABOUT BEING RIGHT.
IT’S ABOUT KNOWING WHAT TO LOOK FOR.
Learn to read the chart📊
2
236
🚨 I’M FULLY CONVINCED THE MAJORITY OF FINX DOESN’T ACTUALLY KNOW WHAT THEY’RE DOING.
Some of the stocks I’m seeing people buying genuinely leave me shaking my head.
I open the charts and see:
Lower highs.
Lower lows.
Major support breaking down.
CLEAR DOWNTRENDS.
Yet people keep buying 🤦🏾♂️
And what concerns me even more? Some of the BIG accounts influencing thousands of people with their stock picks.
WHY NOT SHORT THE DOWNTREND, PROFIT IF IT CONTINUES, THEN LOOK TO BUY WHEN PRICE FINDS SUPPORT AND CONFIRMS A REVERSAL?
Genuine question 🤷🏾♂️👀
4
7
386
🚨 $USDJPY — TRADE CLOSED!💰📈
Beautiful price action.
Beautiful execution.
✅ Entries: 158.912 & 159.326
✅ Closed just shy of 160.100 TP
✅ Profits secured!
READ PRICE.
TRUST THE SETUP.
MANAGE THE TRADE.
You don’t need every last pip to win.🎯🔥

🚨 TEXTBOOK PRICE ACTION ON #USDJPY 📈
My BUY orders got triggered this afternoon! 🔥
Here’s the setup:
✅ Bullish rectangle formation.
✅ Breakout above 158.95 resistance.
✅ Retest of broken resistance as support.
✅ Bullish rejection at the retest.
🎯 Target: 160.17 (previous daily highs).
FROM THEORY TO REAL PRICE ACTION!
Who else loves trading breakout & retest setups? 👀


2
4
223
🚨 THIS IS WHY I LOVE TEACHING TECHNICAL ANALYSIS!🔥
I’ve been teaching and helping @DividendLu understand technical analysis, market structure and how to read charts and price action.
She sent me this:
‼️I SEE WHAT YOU SAW ON THE MONTHLY CHART!!!‼️
And THAT made my day!🙏🏾
Not the 8% gain.
Not blindly following signals.
Not being told what to buy or sell.
BUT LEARNING TO READ PRICE FOR YOURSELF.
Understand the chart.
Recognise the setup.
Make your own decisions.
KNOWLEDGE OVER SIGNALS ALWAYS. 📊🔥

5
9
413
📊 AND HERE’S THE PART I LOVE EVEN MORE!
@DividendLu is now analysing charts herself.
Identifying key support levels.
Understanding the 200 EMA dynamics.
Building her own watchlist.
Developing her own market outlook.
THIS is the progress that matters.
THE GOAL ISN’T TO FOLLOW MY TRADES.
IT’S TO LEARN HOW TO FIND YOUR OWN🔥

2
2
166
🚨 #USDJPY CHART TOLD THE STORY BEFORE THE MOVE!📈🔥
Yesterday I shared my BUY setup.
Today the trade is playing out beautifully!
✅ Bullish rectangle breakout.
✅ Former resistance retested as support.
✅ Bullish rejection confirmed.
✅ Buyers pushing price higher.
📍 Current price: 159.59
🎯 Target: 160.17
My BUY positions are running in profit.
THIS IS WHY WE STUDY PRICE ACTION.
Not guessing.
Not chasing.
READ THE STRUCTURE.
WAIT FOR CONFIRMATION.
EXECUTE.
Who else caught this move? 👀

🚨 TEXTBOOK PRICE ACTION ON #USDJPY 📈
My BUY orders got triggered this afternoon! 🔥
Here’s the setup:
✅ Bullish rectangle formation.
✅ Breakout above 158.95 resistance.
✅ Retest of broken resistance as support.
✅ Bullish rejection at the retest.
🎯 Target: 160.17 (previous daily highs).
FROM THEORY TO REAL PRICE ACTION!
Who else loves trading breakout & retest setups? 👀
THIS RIGHT HERE 🙏🏾🔥
This is why I keep talking about PRICE ACTION
Not to give people signals
Not to tell people what to buy or sell
But to help people READ CHARTS, understand market structure & make informed decisions independently
KNOWLEDGE OVER SIGNALS
Thank you Eve!👊🏾💪🏾

Big shoutout to @RebuiltByGrace his focus on pure price action and market structure has been one of the most practical things I’ve learned in trading.
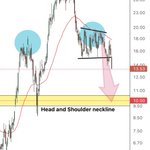
The $SOFI breakdown (head & shoulders + bearish wedge toward 10) is a perfect example of reading what price is actually saying instead of guessing.
Grateful for the honest, no-hype lessons. Still working on applying it consistently, but the shift in how I look at charts has been real.
Appreciate you sharing the process.
LEARN PRICE ACTION.
LEARN PRICE ACTION.
LEARN PRICE ACTION.
LEARN PRICE ACTION.
LEARN PRICE ACTION.
LEARN PRICE ACTION.
The market doesn’t care about your opinions.
LEARN TO READ WHAT PRICE IS TELLING YOU.
🚨 GOLD #XAUUSD BEARISH STRUCTURE IS GETTING HARDER TO IGNORE 📉
Here’s what the price action is telling me:
📌 6 MONTH: A textbook shooting star formed first half of 2026, signalling rejection at higher prices. Second half of 2026 continues to show bearish pressure.
📌 MONTHLY: Lower highs developing. October broke below KEY 4000 support, with November still trading beneath it.
📌 KEY LEVEL: A November close below 4000 strengthens the bearish case towards 3500. A sustained reclaim would challenge that outlook.
📌 #USDX : The bullish pennant breakout I previously shared supports the thesis. Dollar strength towards 107 could add further selling pressure on gold.
THIS IS WHY MULTI TIMEFRAME ANALYSIS MATTERS.
Understand the bigger picture. Identify the structure and manage the risk.
STOP GUESSING.
START READING PRICE.
Does gold reclaim 4000 or is 3500 next?


🚨 THEY LAUGHED AT MY $SOFI ANALYSIS.
18 August : 17.98
Today: 14.28
I flagged the head & shoulders, bearish wedge and a potential move towards 10.
While many were focused on buying, I was focused on MARKET STRUCTURE and I went short.
The bearish setup is playing out and 10 remains on my radar.
STOP GUESSING.
START READING PRICE.
Are you going to keep buying $SOFI here or finally wait for price to confirm?


📌 A FALLING STOCK ISN’T AUTOMATICALLY CHEAP OR A BUYING OPPORTUNITY.
Lower highs.
Weakening momentum.
Support breaking down.
The warning signs were there. The bearish market structure was developing.
PRICE ACTION ISN’T ABOUT PREDICTING. IT’S ABOUT PREPARING.
Learn to read price before risking your money.
New day.
New opportunities.
Same discipline.
Same patience
Stay focused.
Trust the process.
Good morning
Happy Wednesday FinX Fam! 🙏🏾 ☀️☕️

🚨UNPOPULAR OPINION
‼️DCA IS OVERRATED‼️
Why buy stocks or crypto making LOWER HIGHS & LOWER LOWS?
Why not wait for PRICE ACTION to confirm a reversal?
Investors hide behind “DCA” coz they don’t understand market structure
Am I wrong OR are we avoiding that conversation?👀
@SriPortfolio I’d like to hear your thoughts or opinion on this? 👀
1
1
20
🚨 TEXTBOOK PRICE ACTION ON #USDJPY 📈
My BUY orders got triggered this afternoon! 🔥
Here’s the setup:
✅ Bullish rectangle formation.
✅ Breakout above 158.95 resistance.
✅ Retest of broken resistance as support.
✅ Bullish rejection at the retest.
🎯 Target: 160.17 (previous daily highs).
FROM THEORY TO REAL PRICE ACTION!
Who else loves trading breakout & retest setups? 👀
Let me be CLEAR.
I’m NOT talking about investing in the S&P 500 for 20 years.
I’m talking about blindly buying individual stocks and crypto in clear DOWNTRENDS.
At what point does “buying the dip” become refusing to admit you’re WRONG?
Is DCA a strategy or an EXCUSE? 👀🔥
2
124
🚨 DROP ONE TICKER OR A PAIR YOU WANT ME TO ANALYSE THIS WEEK! 📊
Stocks?
Crypto?
Forex?
Gold?
Let’s break down:
Market structure.
Key levels.
Price action.
Potential trading setups.
YOU pick the chart.
I’LL do the breakdown! 🔍👇🏾
8
8
368
