







Pinned Tweet
Final Reminder: Smarter Web Livestream tomorrow, Thursday 29 October, 14:00 GMT / 15:00 CEST / 10:00 ET
The boys are reunited.

Final Reminder: Smarter Web Livestream tomorrow, Thursday 29 October, 14:00 GMT / 15:00 CEST / 10:00 ET.
@millercole is joined by @benharvey, Digital Assets Researcher at Keyrock.
The conversation will explore Ben’s research on Bitcoin treasury companies, Digital Credit and capital structure.
Watch live here on X or Youtube.
LSE: #SWC #MORE | OTCQB: $TSWCF | FRA: $3M8
SWC-Wiki retweeted

$MORE Day 11: traded 1,013 shares worth £90,000 today, equal to 0.9% of shares issued.
10-day average volume: 2,088 shares a day. 24,682 shares traded since launch, 22.2% of shares issued.
Closing mid price was £89.00.
LSE: #SWC #MORE | OTCQB: $TSWCF | FRA: $3M8


SWC-Wiki retweeted
UK government debt is over £3 trillion. The 30-year gilt yield hit a 28-year high this month. Today, borrowing was revised up in each of the next five years.
Nothing stops this train.
LSE: #SWC #MORE | OTCQB: $TSWCF | FRA: $3M8


UK Budget day
UK Budget day: Why the speech matters less than the backdrop
Today’s Budget is being treated as the main event. I think the backdrop matters far more than anything said in the Commons later today.
The Budget has been briefed almost line by line. The fiscal rules are expected to be met, headroom is expected to land somewhere between £10bn and £15bn (down from £23.6bn in March), and the harder decisions on welfare and departmental spending have been pushed towards next year’s spending review.
That is tinkering around fiscal rules of the government’s own making, tested in 2029-30, while the trajectory stays untouched. That trajectory has held under successive governments: a debt stock that has tripled since it first passed £1 trillion in 2010, and borrowing stuck at 4% to 5% of GDP every year since the pandemic.
1. The debt
The ONS reported last week that public sector net debt has passed £3 trillion for the first time. It stands at £3,005bn, or 94.0% of GDP.
September borrowing was £24.5bn. That is the second-highest September on record behind 2020, and £1.8bn higher than a year earlier. Borrowing for the first half of the financial year is £6bn above the OBR’s forecast, so the numbers are being missed before the new forecast is even published.
Debt interest was £10.9bn in September alone. That is the highest for any September since records began in 1997, before adjusting for inflation. It is also only the eighth month on record above £10bn. It was £2.0bn above the OBR’s forecast. £4.0bn of it was an accounting charge for inflation on index-linked gilts, which shows how exposed the interest bill is to rising prices.
2. The cost of carrying it
The UK now spends more than £115bn a year servicing its debt, roughly double the defence budget.
The Chancellor made the point himself in September. £1 in every £10 the government spends now goes on debt interest. If it were a department, he said, it would be the second biggest in Whitehall after Health, and he called spending on it “nothing progressive”.
That is the context for the defence announcement. It is expected to include around £4.7bn to fill a gap in the Defence Investment Plan, plus billions routed through the National Wealth Fund and British Business Bank, to be invested in defence and technology companies. None of it is being paid for by cutting spending, because the harder decisions on both have been deferred. It is paid for with long-term borrowing, due to begin in 2028-29, and the timetable to 3% of GDP has moved to next year’s spending review.
The government’s case is that this is investment, and that the returns will outrun the cost of the borrowing. That is a reasonable argument and it may prove right. But the cost is known and the return is an estimate. The government pays around 5% to 6% to borrow today. The Treasury has also said it is lowering the discount rate in its Green Book, the rulebook for appraising projects, from 3.5% to 3%. That rate sets how much future benefits are worth against today’s costs, so a lower rate makes it easier for projects to pass.
Because the money sits in public financial institutions as an asset, it is also not expected to count against the government’s debt rule. Borrowing can rise and the rule can still be met. In my view that is the weakness of rules of the government’s own making.
3. What the market is saying
The 30-year gilt yield went through 6% on 1 October for the first time since 1998. It peaked at 6.036% on 7 October, and the UK became the first G7 economy to pay 6% on long-term borrowing since the euro crisis in 2012.
The 10-year is around 5.35%. Yesterday the DMO sold £4.5bn of five-year gilts at 5.04%, the highest yield since 2008.
Some of this is global, but the global picture has eased. The US 30-year yield hit 5.73% on 7 October, its highest since 2002, and is now around 5.30%. The US 10-year has fallen from 5.36% to about 5.00%. UK yields have come off too: the 30-year is around 5.76%, down from 6.04%, and the 10-year is around 5.35%, down from a high of 5.53%.
Part of the UK’s breathing room is that the Bank of England stopped selling long-dated gilts on 17 September. The rest, in my view, is that bond investors are looking at France. Its 10-year yield went above 5% for the first time since 2002 amid riots and doubts over its budget, and the gap over German Bunds hit its widest since 2011.
However, the UK’s 10-year still yields more than France’s, UK yields remain the highest in the G7, and investors still point to the UK’s exposure to inflation shocks and years of political uncertainty as the reason they charge a premium.
4. What traders are watching
The DMO’s revised remit, published alongside the Budget, is the number the market cares about most. It sets how many gilts the government plans to sell this year. The April plan was £246.2bn. Consensus is for a rise of about £3.4bn, with some forecasts as high as £10bn.
The other thing to watch is the type of gilt. The expectation is fewer long-dated gilts and more short-term borrowing, because the market is demanding so much to hold the long end. The long-dated share is forecast to fall to its lowest in over 35 years. That's really just a way to change how the government borrows, not how much. It lowers the interest cost today and increases the exposure to rate rises later, while the borrowing itself stays where it is.
5. The point
Whichever way the speech lands, the issue is the same. Debt is above £3 trillion, interest costs are about double the defence budget, borrowing is running ahead of forecast, and the main response to every constraint is to defer the decision. The fiscal rules are of the government’s own making and are measured in 2029-30, so they can be met on paper while debt in pounds and the interest bill both keep rising.
A Budget moves the numbers by a few billion either way. It does not change the arithmetic. Around £141bn of this year’s gilt sales simply replaces maturing debt, now refinanced at yields of 5% to 6%. Headroom of £10bn to £15bn does not go far against that: ING estimates a one percentage point rise in yields across the curve adds £8.4bn to the annual interest bill by 2029-30.
This is the environment in which I find the case for Bitcoin easiest to make. The government’s fiscal rules are written by the government, measured years in the future and can be redrawn at any Budget. Bitcoin’s rules are written in code and enforced by thousands of independent nodes. Supply is fixed at 21 million and issuance follows a schedule set in advance. No Chancellor, remit or review can change that by announcement.
I believe that makes it a hedge against exactly this kind of fiscal drift.
This is my personal view and not financial advice.
LSE: #SWC #MORE | OTCQB: $TSWCF | FRA: $3M8
SWC-Wiki retweeted
UK Budget day: Why the speech matters less than the backdrop
Today’s Budget is being treated as the main event. I think the backdrop matters far more than anything said in the Commons later today.
The Budget has been briefed almost line by line. The fiscal rules are expected to be met, headroom is expected to land somewhere between £10bn and £15bn (down from £23.6bn in March), and the harder decisions on welfare and departmental spending have been pushed towards next year’s spending review.
That is tinkering around fiscal rules of the government’s own making, tested in 2029-30, while the trajectory stays untouched. That trajectory has held under successive governments: a debt stock that has tripled since it first passed £1 trillion in 2010, and borrowing stuck at 4% to 5% of GDP every year since the pandemic.
1. The debt
The ONS reported last week that public sector net debt has passed £3 trillion for the first time. It stands at £3,005bn, or 94.0% of GDP.
September borrowing was £24.5bn. That is the second-highest September on record behind 2020, and £1.8bn higher than a year earlier. Borrowing for the first half of the financial year is £6bn above the OBR’s forecast, so the numbers are being missed before the new forecast is even published.
Debt interest was £10.9bn in September alone. That is the highest for any September since records began in 1997, before adjusting for inflation. It is also only the eighth month on record above £10bn. It was £2.0bn above the OBR’s forecast. £4.0bn of it was an accounting charge for inflation on index-linked gilts, which shows how exposed the interest bill is to rising prices.
2. The cost of carrying it
The UK now spends more than £115bn a year servicing its debt, roughly double the defence budget.
The Chancellor made the point himself in September. £1 in every £10 the government spends now goes on debt interest. If it were a department, he said, it would be the second biggest in Whitehall after Health, and he called spending on it “nothing progressive”.
That is the context for the defence announcement. It is expected to include around £4.7bn to fill a gap in the Defence Investment Plan, plus billions routed through the National Wealth Fund and British Business Bank, to be invested in defence and technology companies. None of it is being paid for by cutting spending, because the harder decisions on both have been deferred. It is paid for with long-term borrowing, due to begin in 2028-29, and the timetable to 3% of GDP has moved to next year’s spending review.
The government’s case is that this is investment, and that the returns will outrun the cost of the borrowing. That is a reasonable argument and it may prove right. But the cost is known and the return is an estimate. The government pays around 5% to 6% to borrow today. The Treasury has also said it is lowering the discount rate in its Green Book, the rulebook for appraising projects, from 3.5% to 3%. That rate sets how much future benefits are worth against today’s costs, so a lower rate makes it easier for projects to pass.
Because the money sits in public financial institutions as an asset, it is also not expected to count against the government’s debt rule. Borrowing can rise and the rule can still be met. In my view that is the weakness of rules of the government’s own making.
3. What the market is saying
The 30-year gilt yield went through 6% on 1 October for the first time since 1998. It peaked at 6.036% on 7 October, and the UK became the first G7 economy to pay 6% on long-term borrowing since the euro crisis in 2012.
The 10-year is around 5.35%. Yesterday the DMO sold £4.5bn of five-year gilts at 5.04%, the highest yield since 2008.
Some of this is global, but the global picture has eased. The US 30-year yield hit 5.73% on 7 October, its highest since 2002, and is now around 5.30%. The US 10-year has fallen from 5.36% to about 5.00%. UK yields have come off too: the 30-year is around 5.76%, down from 6.04%, and the 10-year is around 5.35%, down from a high of 5.53%.
Part of the UK’s breathing room is that the Bank of England stopped selling long-dated gilts on 17 September. The rest, in my view, is that bond investors are looking at France. Its 10-year yield went above 5% for the first time since 2002 amid riots and doubts over its budget, and the gap over German Bunds hit its widest since 2011.
However, the UK’s 10-year still yields more than France’s, UK yields remain the highest in the G7, and investors still point to the UK’s exposure to inflation shocks and years of political uncertainty as the reason they charge a premium.
4. What traders are watching
The DMO’s revised remit, published alongside the Budget, is the number the market cares about most. It sets how many gilts the government plans to sell this year. The April plan was £246.2bn. Consensus is for a rise of about £3.4bn, with some forecasts as high as £10bn.
The other thing to watch is the type of gilt. The expectation is fewer long-dated gilts and more short-term borrowing, because the market is demanding so much to hold the long end. The long-dated share is forecast to fall to its lowest in over 35 years. That's really just a way to change how the government borrows, not how much. It lowers the interest cost today and increases the exposure to rate rises later, while the borrowing itself stays where it is.
5. The point
Whichever way the speech lands, the issue is the same. Debt is above £3 trillion, interest costs are about double the defence budget, borrowing is running ahead of forecast, and the main response to every constraint is to defer the decision. The fiscal rules are of the government’s own making and are measured in 2029-30, so they can be met on paper while debt in pounds and the interest bill both keep rising.
A Budget moves the numbers by a few billion either way. It does not change the arithmetic. Around £141bn of this year’s gilt sales simply replaces maturing debt, now refinanced at yields of 5% to 6%. Headroom of £10bn to £15bn does not go far against that: ING estimates a one percentage point rise in yields across the curve adds £8.4bn to the annual interest bill by 2029-30.
This is the environment in which I find the case for Bitcoin easiest to make. The government’s fiscal rules are written by the government, measured years in the future and can be redrawn at any Budget. Bitcoin’s rules are written in code and enforced by thousands of independent nodes. Supply is fixed at 21 million and issuance follows a schedule set in advance. No Chancellor, remit or review can change that by announcement.
I believe that makes it a hedge against exactly this kind of fiscal drift.
This is my personal view and not financial advice.
LSE: #SWC #MORE | OTCQB: $TSWCF | FRA: $3M8
Good read from the Cat.
For some SWC context. We’ve had a run, retraced some of it but made a higher low and everyone has gone quiet. Disbelief rally perhaps.
Remember, the bull market hasn’t even got going yet. The hardest and easiest part is, you just have to wait. Bitcoin will do lots of heavy lifting at some point. Until then let Andrew and the team cook.

A bit of a long write-up here.
#Bitcoin and $TOTAL3ES (Total crypto market cap without counting stable coins, $BTC and $ETH) are at the beginning of stage 2, which is typically thought as an ideal spot for market participants to enter.
This cycle's AI narrative darling, $PLTR, is in stage 2, after hitting 0.5 retracement which is typically early/mid cycle correction behavior. Late cycle correction typically are more drawn out and are shallower.
ISM PMI just broke out of 50 earlier in 2026 after being under 50 for 4 years, indicating the start of economic expansion.
Copper/Gold ratio bottomed earlier in 2026 after being in a downtrend for 4 years, indicating the start of economic expansion.
Japan #Nikkei broke out of a 35-year consolidation in 2025 and has more room to run up.
Korean $KOSPI seems to be bottoming at 0.5 retracement with a good reaction, which quite often happens in an early cycle/mid-cycle correction. 50% of the $KOSPI is #Samsung and #SKHynix, both continue to have continued growth acceleration to support the numbers. I doubt that the memory trade is anywhere near done yet.
China solana:3aSu9uuDLiWkBQGycJDDSubZEPb6YJjDzULPWZkJn8ic #HangSengIndex had a big run in 2024-2025 just to spend 2026 to retrace back to 0.618 which is a reasonable correction for a likely next leg up, with liquidity likely to spill over to global markets. Their GDP has been growing despite tariffs, youth unemployment and housing crash.
Russell 2000 $IWM $RUT is just making higher highs and higher lows.
Cathie Wood's $ARKK fund is in a 5-year bullish formation that could be breaking out at anytime, and nobody even cares about what that could mean.
$TSLA earnings was not that great, but its weekly trend is flipping bullish regardless. $300 seemed like the number it wanted to hit before finally running up. Market seems to be pricing in future growth which typically happens when it's anticipating economic expansion.
$COIN is forming a very painful $COIN base, but is showing key base-forming behavior which could lead to outsized gain shall it finally breaks out.
AI data centers could be going through final capitulation zone as they are hitting my crazy targets and finding a decent reaction off of them. With the large caps and market leaders like $NVDA $MSFT $GOOGL $AMZN having great balance sheet and cash flow and with them committed into CAPEX for AI infrastructure, this is not your dot-com bubble and this could keep going on for a while. Narratives and sentiment on this sector is horrible, and massive capitulation followed by short squeeze seems to be in order for $CIFR $IREN $NBIS $WULF $GLXY and other names.
$HOOD was the fintech leader that needed to take a breather, while $SOFI plays catch up after solidifying a higher low. Looking at $AFRM and $SHOP - they are two of those stocks that look ready to breakout massively to the upside in 2027 which goes along with economic expansion rather than contraction.
There are still tons of names in forming huge bases for years or sometimes even decades that have yet to break out - many of which look like $MU and $INTC prior to their big run-up and are waiting for their turn once accumulation is complete.
Long duration bonds are starting to catch a bid at the current levels after forming bullish divergences for years, whereas bond yields seem to be going through a topping process after forming bearish divergences for years. This, of course, happens after everyone including CNN front page started talking about yields.
Gold and Silver have been going up for the last 3 years and have finally peaked in 2026 and are both consolidating. Last time Gold peaked was in August 2020, and a very risk on market happened afterwards presumably linked to rotation.
I don't give a damn what Kevin Warsh says tomorrow or what the short term market volatility that comes with his nonsense.
SWC-Wiki retweeted

☕🍊 GOOD MORNING, SWC COMMUNITY!
While Westminster counts the pennies today, Andrew's building the Bitcoin treasury! 🟠
🚀 $SWC — 2,850 BTC in the vault
💰 $MORE — 12% annualised preferred dividend rate
📅 Next ex-dividend: 29 October
🍹 The dream? MORE dividends, LESS working!
$SWC for growth. $MORE for income. $BTC for the future.
No FOMO. Just conviction, some patience and Piña Coladas! 😎🍹
#SWC #MORE #BTC
SWC-Wiki retweeted
COULD YOUR NEXT CAR HELP BUILD YOUR INVESTMENTS?
Following my posts on income and compounding, here’s another way to look at your monthly spending.
Choose a car that costs less to own, then invest the difference in $MORE.
You still have a new car. But some of the money you would have spent running it starts buying an investment instead.
LET’S PUT SOME NUMBERS BEHIND IT.
Autotrader reported an average advertised new petrol-car price of £43,405 in April 2026, after discounts.
That is a published price benchmark, not the average amount every UK buyer actually pays.
Tesla currently advertises the Model Y Rear-Wheel Drive at £44,990, with a representative 0% APR PCP offer:
• £6,850 deposit.
• 47 monthly payments of £349.
• £21,753 optional final payment.
• 48-month agreement.
• 8,000 miles a year.
That final payment matters. £349 a month does not buy the car outright.
For this comparison, we include the final payment so that both cars are fully paid for after four years.
THE PURCHASE AND FINANCE COST.
Petrol-car example:
£43,405 purchase price.
£6,850 deposit.
The remaining £36,555 financed over 48 months at an assumed 8.9% APR, with no balloon.
That works out at approximately £902 a month.
Total paid to own it: approximately £50,146.
Of that, approximately £6,741 is interest.
The 8.9% is an illustrative rate, not a claim about the national average. Your actual finance quote could be lower or higher.
Model Y:
Total paid to own it, including the deposit and final payment: £44,990.
Interest under the advertised offer: £0.
That gives the Tesla a £5,156 purchase-and-finance advantage in this example, despite its higher cash price.
It also explains why comparing monthly payments alone can be misleading: the Tesla has a large payment deferred to the end.
NOW THE ENERGY COST.
Assume both cars cover 8,000 miles a year.
For the petrol car:
• 40 miles per UK gallon.
• Petrol at 174.79p per litre, the RAC’s published figure on 9 October.
• Annual petrol bill: approximately £1,589.
For the Model Y:
• An assumed 3.5 miles per kWh measured from the electricity meter, including charging losses.
• All charging at home.
• Electricity at 26.32p per kWh, Ofgem’s current average capped direct-debit unit rate.
• Annual charging bill: approximately £602.
Annual energy saving: approximately £988.
That uses standard home electricity pricing. An appropriate overnight EV tariff could reduce charging costs further.
Public charging, winter weather, motorway speeds and your driving style can change the result considerably.
THE OTHER COSTS COUNT TOO.
Here are explicit annual budget assumptions, rather than pretending every driver gets the same insurance quote or maintenance bill:
Petrol car:
• Insurance: £900.
• Servicing and maintenance: £350.
• Tyres: £300.
Model Y:
• Insurance: £1,100.
• Servicing and maintenance: £150.
• Tyres: £350.
So this example allows the Tesla to cost more for insurance and tyres.
I’ve also included a £1,000 one-off home-charger installation budget. Actual installation quotes vary.
For vehicle tax, assume the petrol car’s original list price exceeds £40,000 and the Model Y remains below the £50,000 electric-car threshold.
At current rates, years two to four cost:
• Petrol: £640 a year, including the expensive-car supplement.
• Model Y: £200 a year.
First-year tax is assumed included in each purchase price. Future tax and energy rates are held constant purely for the calculation.
WHAT ABOUT DEPRECIATION?
This is one of the biggest ownership costs.
For a transparent comparison, assume each car is worth £20,000 after four years. That is a modelling assumption, not a resale forecast.
Add purchase and finance costs, energy, insurance, maintenance, tyres, subsequent vehicle tax and the Tesla charger. Then subtract that assumed resale value.
FOUR-YEAR NET OWNERSHIP COST:
Petrol car: approximately £44,622.
Tesla Model Y: approximately £35,396.
Difference: approximately £9,226.
That is equivalent to approximately £192 a month, or £44 a week.
This is an average ownership-cost difference, not a promise that £192 becomes available in cash every month. Deposits, the Tesla balloon and resale proceeds happen at different times.
And resale values matter: if the Tesla were worth £5,000 less than the petrol car at the end, the saving would fall to approximately £88 a month.
BUT IF YOUR ACTUAL BUDGET FREES UP £192 A MONTH…
What could happen if you invested that saving instead of absorbing it into everyday spending?
Using the model’s unrounded saving of approximately £192.21 a month, invested as equivalent weekly contributions into MORE:
Assume a maintained 12% annual dividend rate, shares bought and reinvested at £100, and all dividends reinvested weekly.
AFTER FOUR YEARS
Money contributed: approximately £9,226.
Illustrative investment value: £11,824.
Gain above contributions: approximately £2,598.
At that assumed rate, the holding could then produce approximately £27 a week in dividends.
The car-cost saving has helped build a separate income-producing investment.
IF YOU KEPT SAVING THE SAME AMOUNT FOR LONGER…
These longer examples require you to maintain the saving through future motoring decisions. Today’s Tesla offer does not guarantee that.
After 10 years:
Contributions: approximately £23,065.
Illustrative investment value: £44,507.
Gain: approximately £21,442.
After 20 years:
Contributions: approximately £46,130.
Illustrative investment value: £192,070.
Gain: approximately £145,940.
Those are nominal figures before inflation, investment fees and dealing costs. They assume immediate weekly reinvestment, including fractional shares.
MORE is ISA eligible where supported by your provider. The contributions in this example are around £2,307 a year, within the current £20,000 annual ISA allowance if you have enough allowance available.
You would still need to fund every car payment, including any balloon, independently. Investments are not a guaranteed way to meet a finance commitment.
MORE’s dividend is variable, payments can be suspended, the shares can be redeemed and capital is at risk. Its Bitcoin exposure creates significant risk. These investment figures illustrate the maths, not an expected return.
THE IDEA IS SIMPLE.
Look beyond the monthly car advert.
Compare the full finance cost, charging or fuel, insurance, maintenance, tax and likely resale value.
Then, if your choice genuinely saves money, give that saving a purpose.
A lower motoring bill can do more than make this month cheaper.
Invested consistently, it could help build something you still own long after you’ve changed the car.
$MORE $SWC
Illustrative comparison, not financial advice. Finance offers are subject to eligibility and change. Check your own quotes and read the MORE prospectus.
#TeslaModelY #CostOfOwnership #ElectricVehicles #DividendInvesting #StocksAndSharesISA #MORE
SWC-Wiki retweeted

It’s Budget Day in the UK today, a time for sharpened focus on public and personal finance.
How many of the general public in the UK knows that just 2 weeks ago, a new stock called MORE from Smarter Web arrived on the London Stock Exchange, offering people the route to get a currently 13.33% effective annual yield on their investment, available inside an ISA or SIPP tax efficient wrapper too, with a weekly dividend payment?
(Headline dividend rate: 12% against the reference £100 share price, currently available on the market at £90)

Big congratulations to Oliver

I am delighted to welcome Oliver to the Board. Since joining us, he has become an incredibly important part of the Company, and his experience, judgement and contribution have been invaluable. His appointment is thoroughly deserved and reflects the confidence I have in him as we continue to execute our 10 Year Plan.
I would also like to personally thank Tyler for his support and contribution during the early stages of our journey as a public company. He will always be considered a friend of The Smarter Web Company. I wish him every success for the future.
LSE: #SWC #MORE | OTCQB: $TSWCF | FRA: $3M8
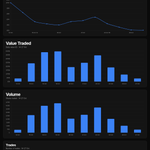
MORE Preferred Shares Dashboard

MORE Preferred Shares Dashboard. Link for interactive chart in the comments.
* We are working in arrears as late trades for any given day won't be added till the following trading day. As an example Friday will look different after Mondays trading is reported.
$MORE

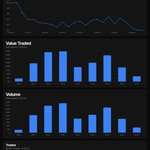
MORE Preferred Shares Dashboard. Link for interactive chart in the comments.
* We are working in arrears as late trades for any given day won't be added till the following trading day. As an example Friday will look different after Mondays trading is reported.
$MORE
MORE Preferred Shares Dashboard.
Link for interactive chart in the comments.
* We are working in arrears as late trades for any given day won't be added till the following trading day. As an example Friday will look different after Mondays trading is reported
$MORE


SWC-Wiki retweeted

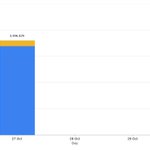
$SWC Tue 27 Oct: 46.04p (-2.55%)
📊 918k shares (0.5× avg) · 47% buys
📈 VWAP 46.25p · closed below
🔔 Closing auction 32.7k @ 46.04p
🕓 +2.37m shares reported late
₿ mNAV 1.18×
Full breakdown: swc.guru/day/2026-10-27
Unofficial, not advice
