

I automate the busywork so business owners can get back to business. Swing trader. Chart setups: @FinVigilante
United States
Joined December 2014
- Tweets4.1K
- Following53
- Followers2.3K
- Likes6.6K




Pinned Tweet
Moved the nightly setups to @FinVigilante. One chart a night, exact levels, found by rules after the close.

$KSS confirmed an inverse head and shoulders on the weekly. 33 weeks in the making.
Neckline 20.41
Trigger 20.89
Stop 19.11
Target 29.60
Every night I scan ~2,000 US stocks for classical chart patterns by fixed rules, and post the levels after the close. Not advice.

45
$731M in longs wiped out in a day. Painful, but this still isn't the flush that marks a bottom.
Volume is up but nowhere near panic levels. Real bottoms look uglier than this.
Smaller size, more patience.
Not financial advice. teapaw.org/Truecrypto/status/2123…

Nearly $1,000,000,000 liquidated in 24 hours. $731,000,000 of it longs.
In this price action, that's mind-blowing. And make no mistake, shorts get theirs soon too, in bigger numbers.
Like I've said all week: smaller size, wider stops outside the zone. Give your direction a chance to be right. This isn't surgery.

19
In 2020 the bottom came after a panic selling day and the Fed stepping in.
Bitcoin has neither yet. Volume is normal, the dollar keeps rising and long-time holders are still moving coins.
Not the bottom yet. But it's setting up.
Not financial advice. teapaw.org/TheBirbNest/status/212…

Stocks are falling.
Crypto is falling.
Gold is falling.
Silver is falling.
Only DXY is rising
When markets across different asset classes start selling off together, an important question comes up:
Is this a fundamental collapse, or a liquidity squeeze?
Look back at March 2020.
During the COVID market panic, investors sold almost everything including traditional safe havens like gold to raise cash, meet margin calls and cover losses elsewhere.
This is often called a dash for cash.
Here's how it works:
Investors face losses or funding pressure.
They sell liquid assets to raise cash.
Forced selling creates more downward pressure.
Correlations across asset classes can rise to 1 as different markets move lower together.
In March 2020, central bank intervention and massive liquidity support helped stabilise markets and the recovery followed.
But here's the important lesson:
A broad sell off doesn't automatically mean every asset has a broken fundamental story.
Sometimes liquidity and positioning are driving the move.
Cash can become valuable during periods of forced selling.
But don't assume a policy rescue or a quick rebound is guaranteed.
Watch liquidity, the dollar, bond yields and central bank signals.
Insight: In a liquidity squeeze, even good assets can be sold for the simple reason that investors need cash.

25
The people who've held Bitcoin the longest are moving coins again.
About 245,000 $BTC that sat untouched for 5+ months moved in the past 30 days. That's roughly $15B.
When the patient money starts moving, I don't think the bottom is in.
Not financial advice.

1
36
$BTC just closed under $62K. Fear is at extreme levels but volume says nobody is panicking yet. Feels like we haven't seen the real flush. Watching $58.5K next. Not financial advice.

25
Bitcoin fear index is at 11 out of 100. Everyone's calling a bottom.
I'm not buying it yet.
$16B in stablecoins left crypto in the past 30 days. No panic volume spike either, the kind that marks a real bottom.
If $62K breaks, $58K is next.
Not financial advice.

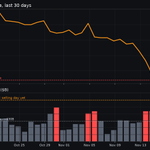
Stablecoin supply fell $16.1B (-5.3%) in 30 days, from $302.5B to $286.4B.
Down 26 of 31 days. Biggest drops: Oct 29 (-$1.5B), Nov 13 (-$1.3B), Nov 6 (-$1.0B).
That's cash leaving crypto, not waiting to buy Bitcoin.
Not financial advice.🧵

1
29
Which stablecoins shrank in the last 30 days?
USDT -$8.1B
USDC -$3.2B
USDS -$1.6B
USD1 -$1.1B
USDT + USDC = about 70% of the drop. Only RLUSD (+$0.3B) and USDe (+$0.2B) grew.
Tether and Circle redeemed more than they issued.

2
18

Where did the stablecoins leave from? Last 30 days by chain:
Ethereum -$12.3B
Tron -$1.3B
Hyperliquid -$1.1B
Solana -$0.7B
~75% of the drop came off Ethereum. Arc (+$0.9B) and Plasma (+$0.3B) gained as some USDC and USDT moved chains.

8
Bitcoin's average drop from its all-time high in past cycles: -82%.
This cycle: -54% at the low, -45% today.
The last 3 bottoms came 12 to 13 months after the top. We're at month 13.
Different this time, or is the real bottom still ahead?
$BTC

44
It bugs me every time I open a new client's account and see money burned on Google's "recommendations." Business owners trust them because they come from Google. They sound helpful, but most of them just raise your spend.
First things I turn off:
- Raise your budget
- Broaden your match types
- Auto-apply
Then I check if tracking is even counting real leads.
1
38
$KSS confirmed an inverse head and shoulders on the weekly today.
33 weeks in the making. Neckline 20.41, trigger 20.89, closed 21.17.
Stop 19.11. Target 29.60.
1 of 12 setups at today’s close. If you want to see the rest: finvigilante.com

76
Only 1 of 12 setups confirmed at today’s close.
An inverse head and shoulders in a retailer most people stopped watching. Line, trigger, stop and target are all in tonight’s post, plus 11 more names that are getting close.
Setups for Tuesday:
finvigilante.com/setups-for-…

38
First nightly list is out: 11 setups for Monday from Friday's close. 8 inverse head and shoulders, 2 double bottoms, 1 base near a breakout.
Every name with its line, trigger, stop, target and negation level. Weekly chart for the shape, daily for the entry. Nothing drawn by hand.
finvigilante.com/setups-for-…

35
I've been running a rules-based scanner for classical chart patterns (inverse H&S, double bottoms, bases, re-tests) across ~2,000 US stocks for my own trading. Starting this week I'm publishing it.
First free Sunday recap: how last week's setups played out, plus 3 names closest to a breakout, with charts.
finvigilante.com/the-week-in…

28
Kodak still exists. And its chart is getting interesting.
$KODK inverse head and shoulders. Neckline 10.31, target 13.15.
Trigger 10.46. Not before.

178
Failed pattern: $AM
Ascending triangle, 26-week base, 4 touches at the ceiling. Looked perfect.
Now it's under the 200d.
Next question: does 19.98 hold and turn this into a rectangle, or does it break?


24-week ascending triangle $AM. Nice rejection at 22.97 today. Trigger sits at 23.21, still watching. No position.

59