

AI and chip news as it happens, explained simply. Research on optics and memory from Asia and US filings. Weekly industry explainers. Econ & finance background.
Joined January 2026
- Tweets2.2K
- Following81
- Followers3.1K
- Likes3.9K


$SNDK’s data center business delivered 88% of its sequential revenue increase in fiscal Q1. The next-quarter outlook calls for another double-digit revenue step.
Revenue reached $11.031B, up 23% from Q4. Non-GAAP EPS was $49.51, versus $39.25 last quarter, and non-GAAP gross margin edged up to 85.1% from 84.6%. GAAP diluted EPS was $52.60.
Against the company’s previous guidance, revenue exceeded the $10.8B upper end by $231M; non-GAAP EPS exceeded the $46 upper end by $3.51. Gross margin was just above the 85% upper end. These are company-guidance comparisons, not Street-consensus comparisons.
Datacenter revenue rose 61% sequentially to $4.802B from $2.977B. That $1.825B increase accounts for about 88% of the company’s $2.066B total revenue increase. Datacenter now represents 43.5% of sales, up from 33.2% in Q4. Edge revenue grew 7% to $5.832B; Consumer fell 29% to $397M.
Fiscal Q2 guidance is $12.2B–$12.6B of revenue, non-GAAP EPS of $55–$57, and non-GAAP gross margin of 84.5%–85.5%. The revenue midpoint implies about 12.4% sequential growth, with gross margin broadly holding around this quarter’s level.
The cash figures need both definitions. Reported free cash flow declined to $6.309B from $7.083B, while adjusted free cash flow increased to $5.696B from $5.035B. The NBM prepayment-and-deposit deduction in that reconciliation fell to $465M from $1.938B. Payment timing affects the comparison. Sandisk also repurchased $5B of shares during the quarter.
All EPS figures above are PRE-SPLIT. Sandisk announced an 8-for-1 split: record date November 9, additional shares issued after the November 19 close, with split-adjusted trading expected November 20. The split changes share count and per-share figures, not ownership percentages or total company value by itself.
Here’s what the release answers:
Q1 — Did growth reach earnings? Answered: non-GAAP EPS increased 26% sequentially with gross margin at 85.1%.
Q2 — Is data center changing the mix? Answered: its revenue share rose by about ten percentage points.
Q3 — Does guidance support another earnings step? Answered as management’s forecast: revenue and EPS midpoints rise, with margins broadly stable.
My read: the data center mix shift strengthens the earnings case. I still want the pricing-versus-volume bridge and the cash economics of NBM contracts before extrapolating these margins further.
For the call:
C1. How much growth came from pricing, bits and product mix?
C2. Which customer ramps support the next data center revenue step?
C3. How should NBM deposits, Flash Ventures funding and buybacks affect cash returns?


$AXTI’s Q3 revenue rose 54% sequentially and GAAP gross margin reached 56%. The InP demand story now has a much larger earnings base behind it.
Revenue was $73.4M, versus $47.6M in Q2 and $28.0M a year earlier. GAAP gross margin increased from 44.9% in Q2 to 56.0%; non-GAAP gross margin was 56.1%.
GAAP operating income reached $28.427M, or a calculated 38.7% of revenue. Net income attributable to AXT was $25.723M, with GAAP diluted EPS of $0.39. Non-GAAP EPS was $0.41, versus $0.19 in Q2. These are comparisons with reported results, not Street consensus.
Management attributes the revenue increase to strong InP demand. Morris Young says the company exceeded its goal of doubling InP capacity and more than quadrupled its 2026 InP “revenue opportunity” through productivity gains and larger-diameter products. I’d keep the wording precise: revenue opportunity is management’s assessment; it is not a reported fourfold increase in realized InP revenue.
The release does not give a separate InP revenue figure, an export-approval schedule, or numerical Q4 revenue and EPS guidance. Those remain questions for the call.
There are also two financial details I want to keep in view. Diluted weighted-average shares were 65.862M, versus 43.842M a year earlier. And Q3 net interest income was $5.895M, so the earnings discussion needs to distinguish operating profit from financial income.
At September 30, cash and equivalents were $485.472M, with another $41.200M of restricted cash. Restricted cash belongs in its own category. This balance-sheet snapshot also predates the October Tongmei financing announcement; it does not establish that the announced financing has closed.
Here’s what the release answers:
Q1 — Did growth convert into profitability? Answered: revenue and gross margin increased sharply, with $28.427M of GAAP operating income.
Q2 — Did InP demand convert into revenue? Partly answered: management identifies InP as the driver, but does not disclose the separate product revenue or license-to-shipment bridge.
Q3 — What changes in Q4 guidance and Tongmei financing? Not answered numerically in this earnings release.
My read: this quarter strengthens the operating-growth case. The next test is whether capacity, export permissions and customer shipments support the next revenue step at comparable margins.
For the call:
C1. What are Q4 revenue, margin and EPS expectations?
C2. How much InP capacity is qualified, permitted and shipping, and what larger-diameter mix is realized?
C3. What are the Tongmei financing closing conditions, ownership effects and uses of cash?


$AMZN turned 12% Q3 sales growth into 61% operating-income growth. AWS is doing more of the earnings work, while the cash bill keeps rising.
Revenue was $201.944B and operating income reached $28.076B, giving Amazon a record 13.9% operating margin. Revenue was near the top of management’s previous $197B–$202B range. Operating income exceeded its previous $22.5B–$26.5B range by about $1.6B at the high end. These comparisons use company guidance.
AWS revenue grew 39.3% to $45.984B. Its operating income reached $17.773B, up about 55%, for a calculated operating margin of 38.7%. AWS generated roughly 63% of Amazon’s total operating income on about 23% of sales.
Retail contributed too. North America operating income rose to $8.723B from $4.789B, while International reached $1.580B from $1.199B. Reported retail growth needs context: Prime Day shifted largely into Q2 this year. Amazon says that timing change reduced consolidated Q3 year-over-year sales growth by approximately four percentage points.
GAAP diluted EPS was $1.89, down from $1.95. Last year’s quarter included $9.5B of pre-tax Anthropic investment gains. I’d put the operating-income comparison ahead of the headline EPS change when judging the business.
The cash cost remains substantial. Trailing-twelve-month operating cash flow was $168.3B, while net property-and-equipment purchases were $210.7B, leaving $42.4B of negative free cash flow. Those figures cover the same twelve-month period. The separate 2026 cash-capex outlook remains approximately $220B.
Q4 revenue guidance is $240B–$247B, with operating income of $28.5B–$33.5B. The midpoints are $243.5B and $31B. Jassy also projects AWS growth above 40% in both 2027 and 2028; that is management’s forecast, with the usual incentive to present the investment case positively.
Here’s what the release answers:
Q1 — Is AWS accelerating? Answered: Q3 growth was 39.3%, following 36.7% in Q2.
Q2 — Are profits broadening? Answered: AWS, North America and International all increased operating income year over year.
Q3 — Is cash generation covering infrastructure spending? Answered for the trailing year: no, using Amazon’s stated free-cash-flow definition.
My read: stronger AWS growth and broader operating profit support the investment case. Whether that spending produces durable cash returns is still the question I want management to address.
For the call:
C1. What capacity, signed demand and deployment assumptions support the 2027–2028 AWS growth forecast?
C2. How does cash capex translate into capacity, depreciation and eventual free cash flow?
C3. How much of the retail margin improvement persists after the Prime Day timing effects unwind?


$INTC’s Q3 data center revenue jumped 78%, but its Q4 margin outlook puts a limit on how far I’d extrapolate this quarter’s earnings.
Revenue came in at $16.513B, up 21% year over year. Non-GAAP EPS was $0.52, versus $0.23 a year earlier, and non-GAAP gross margin rose to 44.1% from 40.0%. GAAP diluted EPS was $0.60.
Against Intel’s own previous Q3 guidance, revenue was inside the $15.8B–$16.8B range and above its $16.3B midpoint. Non-GAAP EPS exceeded the $0.38 outlook by $0.14, and gross margin exceeded the 42% outlook by 2.1 percentage points. Those are company-guidance comparisons.
The business split matters. Data Center and AI revenue reached $7.318B, with $3.039B of segment operating income. Client Computing and Physical AI revenue fell 5% to $8.097B. Intel has a much stronger server business alongside a weaker PC market.
Foundry’s operating loss narrowed to $1.853B from $2.321B a year earlier. Its $6.697B revenue includes internal transactions. That figure cannot be read as external customer revenue or added to product sales without eliminations.
Now look at Q4: revenue guidance is $15B–$16B, non-GAAP EPS $0.25, and non-GAAP gross margin 38%. The $15.5B revenue midpoint is about 6.1% below Q3; the margin outlook is 6.1 percentage points lower. That is a sequential comparison, not a Street-consensus comparison.
Here’s what the release answers:
Q1 — Are products improving? Partly answered. Server revenue and profit grew sharply; client revenue declined.
Q2 — Are foundry losses narrowing? Answered: down $468M year over year, with a substantial loss remaining.
Q3 — Do process milestones establish external foundry demand? Partly answered. Intel released its 14A 0.9 PDK in October; that milestone alone does not establish committed external manufacturing revenue.
My read: the server earnings recovery has firmer support. The Q4 margin reset and remaining foundry loss keep me cautious about the pace of the broader turnaround.
For the call:
C1. What explains the Q4 gross-margin decline, and how much comes from mix, ramp costs or supply constraints?
C2. How quickly can Xeon supply expand while management expects the PC slowdown to continue through at least H1 2027?
C3. What external foundry commitments and economics accompany the process milestones?


$AMZN Q3 operating income reached $28.1B and a record 13.9% operating margin, while AWS revenue grew 39.3% year over year.
Q3 revenue: $201.9B. GAAP diluted EPS: $1.89.
AWS revenue: $46.0B; operating income: $17.8B.
Q4 guidance: revenue $240B–$247B; operating income $28.5B–$33.5B.
2026 cash capex outlook remains approximately $220B.
$INTC Q3 revenue rose 21% to $16.5B, led by 78% growth in data center and AI revenue. Q4 guidance points to lower revenue and margins.
Q3: GAAP EPS $0.60; non-GAAP EPS $0.52; non-GAAP gross margin 44.1%.
Q4 guidance: revenue $15B–$16B; non-GAAP EPS $0.25; non-GAAP gross margin 38%.
Schulz Duggan retweeted

Day 25/
We are doubling all usage limits for all Pro 100/200/500 tiers and Business Premium, effective today.
We heard your kind feedback and won’t be reducing usage limits for Pro 200, so your Work and Codex usage will stay the same. We’re also going to continue offering extended limits for dots for now, and usage of your dot will still continue to be separate from your default usage.
And we'll of course also keep shipping better models and other efficiency improvements that increase your effective usage over time.
$AXTI reports Q3 after the close today. My read: a beat is possible, but the $66M / $0.31 quarter is already in the price. The stock needs evidence that AXT can turn its 2027 capacity plan into permitted, profitable shipments.
Start with the bar. AXT reported $47.6M of Q2 revenue, $0.19 of non-GAAP EPS and a 44.9% GAAP gross margin. Indium phosphide contributed a record $30.7M.
For Q3, management identified approximately $66M of revenue it could realize from products that either had export permits in hand or did not need one. It guided to $0.29–0.31 of GAAP EPS and $0.30–0.32 non-GAAP. Yahoo's current consensus is $66.0M and $0.31.
That distinction matters. AXT's guide is a high-confidence floor, but Wall Street has already copied the floor into its model. Reporting $66M and $0.31 would mean the company delivered what it laid out. It would not answer how much additional demand can clear the permit gate.
There is room for upside. One quarter earlier, AXT entered Q2 with roughly $34M of realizable revenue under the same permit-or-no-permit framing and finished at $47.6M. I would not mechanically apply that 40% uplift again. Permit timing remains outside the company's control, and the Q3 base is much larger. Still, it explains why the headline consensus can be beaten.
The first number I will check is gross margin. Q2 reached 44.9% as InP volume absorbed fixed costs and lifted mix. On the call, management told analysts to stay around 45% for Q3, while saying its internal target begins with a four and could eventually begin with a five. A revenue beat with gross margin below 43% would tell me the ramp is costing more than expected. A result around 44–46% would preserve the current economics. At 47% or above, pricing, diameter mix and utilization would be compounding faster than the market model.
The second number is Q4 guidance. Consensus currently sits at $77.45M of revenue and $0.36 of EPS. My base range is $75–80M. Below $75M would suggest permits or the capacity ramp are interrupting the trajectory. Above $80M would matter more than a small Q3 beat because it moves the exit rate.
The third test is 2027. Management said it was targeting about $60M of quarterly InP capacity exiting 2026 and roughly $130M exiting 2027. The wording on the latter was loose: an executive referred to “revenue” while answering a capacity question, and analysts immediately repeated it as capacity. I treat $130M as a production-value target, not booked quarterly revenue.
Demand visibility is real but does not remove the execution gap. Backlog was already above $100M in July. AXT said it extended into 2027, and long-term supply agreements reached further. Casela and Coherent prepaid $22.3M and $25.4M for supply. Those are stronger signals than a non-binding forecast, but capacity is still not revenue. AXT must install and qualify output, secure export permits for overseas customers and protect yield while it scales.
That is also why the customer mix matters. China represented more than half of Q2 revenue and domestic shipments do not face the same export-permit gate. Faster China sales can produce a clean quarter while leaving the North American bottleneck unresolved. I want management to separate volume growth from permit progress rather than blend the two into one demand statement.
At the Oct. 29 snapshot price of $62.94, the stock trades at roughly 28x the unchanged $2.25 2027 EPS consensus. The valuation is no longer asking whether Q3 revenue can reach $66M. It is asking whether the company can climb from a $60M quarterly InP capacity exit rate this year toward $130M next year without losing margin or access to overseas customers.
My scorecard is simple:
• Bear: revenue below $66M, gross margin below 43%, Q4 guide below $75M, or weaker permit language.
• Base: $66–70M, 44–46% gross margin and a $75–80M Q4 guide, with the 2027 capacity path intact.
• Bull: revenue above $70M, gross margin at least 47%, Q4 guidance above $80M and new evidence that 2027 capacity is funded by customer commitments.
I expect the quarter itself to be solid. The trade turns on whether management can put dates, permits and customer commitments behind the 2027 number.


$SSNLF 005930 KS
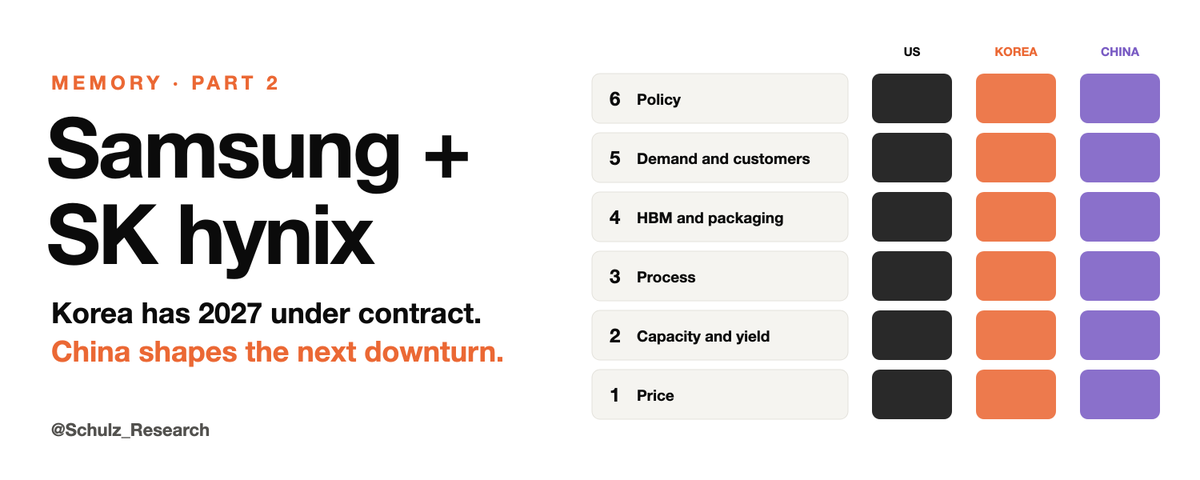
Samsung paid ₩26.9T for property and equipment in the third quarter, almost double the second. Chip revenue growth slowed from 56% to 15% over the same stretch. Planned 2026 facility spending is now ₩84.4T, up ₩31.7T.
Samsung says buildings and tool prepayments come first, so capex runs ahead of wafers, and it expects supply to stay tight in 2028. More in part 2 of our memory series.


$LRCX $KLAC $ASML $SKHY
Korea made 64% of the world's DRAM revenue last quarter and about 83% of HBM. Its companies sell 3% of the world's chip equipment. US firms sell 37%, Japan 28%, Europe 27% (2023, Global Net via Japan's trade ministry).
It runs both ways: memory was 46% of Lam's and ASML's system sales last quarter, and China 35% of Lam's revenue. Who needs whom, in part 2 of our memory series.

To ensure the right balance between timeliness and research depth, I’d love to get your feedback on how you prefer to consume earnings breakdowns this season:
50%Keep Split Updates
50%Consolidated Summary
6 votes • 1 days$CXMT $MU $SKHY
CXMT's first-half gross margin was 84.84%, against 86.8% at Micron. In its own exchange filing it calls itself a price taker: its prices fell 43.5% in 2023 when the market fell 40.2%, and rose 55.1% in 2024 when the market rose 60.7%.
Where China matters is output, which it didn't cut last time. More in part 2 of our memory series.

$MU $SKHY $SSNLF $CXMT
In the 2023 memory downturn, SK hynix cut capex 66.5% and Micron 36.4%. Samsung held chip capex flat (+1.0%) and cut output. CXMT raised capex 23% while losing ¥16.3bn on ¥9.1bn of revenue, and ran its fabs at 87%.
Next time CXMT starts with about 10% of DRAM. Full table in part 2 of our memory series. Who cuts first next time?

$SKHY $SSNLF $MU $CXMT
SK hynix said "sold out through 2029." The signed part is smaller: more than 50% of 2027–28 capacity, 14 customers, usually five years, with deposits. The rest counts volume still in negotiation, plus HBM requests of more than 2x supply that aren't orders.
Samsung has 10 customers signed, 10 in talks, and no disclosed terms.
We sorted all three makers' contract claims from signed to forecast in part 2 of our memory series. Which would you trust in a downturn?

$SSNLF 005930 KS
Samsung's chip division made ₩106.5T of operating profit in 3Q26. That's more than all of $SKHY earned in the same quarter (₩83.3T), and it's 99% of Samsung's group profit.
3Q26 final (K-IFRS):
Revenue ₩195.3T, +14% QoQ, +127% YoY (prelim ₩195.0T)
Operating profit ₩107.4T, +20% QoQ, margin 55.0% (2Q 52.2%)
DS (chips) ₩106.5T on ₩147.1T of sales, a 72% margin (2Q 70%)
Memory sales ₩140.7T, +16% QoQ
Phones, TVs and appliances -₩0.8T, same as 2Q
Net profit ₩75.1T, EPS ₩11,462
Net cash ₩197.6T
The number that moved most is capex. Samsung spent ₩26.9T on property and equipment in the quarter, almost double 2Q's ₩14.1T and 2.5 times a year ago. Revenue growth slowed from 28% to 14% QoQ while spending stepped up.
On 2027, the company expects AI demand to tighten memory supply further than this year, and says it'll build its sales base on long-term contracts. HBM4 sales "significantly scaled up" in 3Q, with prices up across all applications. Foundry's first Taylor fab starts operations, and Samsung says its 2nm HPC wins now include major hyperscalers.
Shareholders get ₩30T in 3Q dividends, ₩4,601 a share. Of the ₩90–110T planned for 2026, ₩35T is done or committed. The other ₩55–75T will include a large buyback and cancellation, with the plan set at the board meeting in late January.
Below operating profit, the finance line swung to a ₩9.5T loss from a ₩4.7T gain in 2Q. The materials don't say why.
For the call (10am Seoul):
C1 What drove the ₩9.5T finance loss
C2 How much of 2027 HBM4 is under long-term contract, and on what pricing terms
C3 Where the ₩26.9T of capex went, and what 2027 capex looks like
C4 Whether memory costs keep phones and TVs in the red into 4Q


$MRVL $LITE
Marvell lost about $18B of market value after hours on a Bloomberg report that it's in advanced talks to buy Lumentum. Lumentum gained about $9B. Add the two together and they were worth roughly $9B less than at the close.
What's reported so far: Bloomberg, citing people familiar with the matter, says the talks are advanced and a deal could be announced as soon as next week. Neither company has confirmed it, and no price or structure has come out. So for now it's a report, not a deal.
After hours, Lumentum went from $913.95 to about $1,019 (+11.5%) and Marvell from $251.65 to about $231 (-8.2%). Coherent was up 2.7% and Applied Optoelectronics 1.3%.
The size is the first thing that stands out. At the close Lumentum was worth $82.0B, a bit more than a third of Marvell's $220.7B. And Lumentum's stock is up 4.6x over the past year vs 2.85x for Marvell, so Marvell would be paying for it near the top of that run.
What Marvell would get: Marvell sells the DSPs and other electrical chips inside optical modules, and Lumentum makes the indium phosphide lasers that put light on the fiber. Together they'd cover both the electrical and the optical side of the transceiver.
If it's announced, the numbers that matter are the price per share and the split between cash and stock. With Lumentum at more than a third of Marvell's size, that split decides how much of Marvell current holders keep.


$SIMO
Silicon Motion guided Q4 revenue to $588–616M. Analysts had $550M for Q4 going in, so even the low end is 7% above that, and the Q3 it just reported was already $560M.
Q3 revenue $560.2M, up 24% from Q2 and 131% from a year ago, against a $519–541M guide and $529M consensus. That's every quarter since Q2 2025 above the top of its own guide. Non-GAAP gross margin 53.7% (guide 50–51%), operating margin 32.1% (guide 27.5–28.5%), EPS $4.35 vs $3.33 expected.
GAAP EPS fell to $1.91 from $3.99, while operating income rose to $162.6M from $101.1M. The gap is investments: a $78.0M loss this quarter after a $74.7M gain in Q2.
By product, vs Q2:
SSD controllers +20–25%
eMMC/UFS controllers −10–15%
Ferri and boot drives +75–80%
Management says rising memory costs are squeezing some consumer devices, while enterprise and Ferri customers care more about getting supply than about price.
The Q4 guide also has non-GAAP gross margin at 54–55% and operating margin at 36–37%. Q1–Q3 plus the Q4 range puts 2026 revenue at $1.94–1.97B, vs $886M in 2025 and a $1.87B full-year consensus.
Cash is $953.6M, up from $181.8M, after the $1.15B zero-coupon convert in August.
The stock was around $227 after hours, about 3% above the close, after a roughly 16% run in the two sessions before the report.
For the call (8am ET):
C1 How much MonTitan revenue is in the Q4 guide, and which customers are ramping.
C2 What takes gross margin to 54–55%: product mix, or pricing on Ferri and boot drives.
C3 Whether the eMMC/UFS drop is price or units, and whether it keeps falling in Q4.
C4 What the $1.15B is for, and where the $78M investment loss came from.


$MSFT
Microsoft guided December-quarter Azure growth to 49–50% in constant currency, faster than Q1's 48%, and it's doing that while some rented GPU capacity slips. Amy Hood said a few third-party GPU-as-a-service contracts were pushed into the second half, and engineering efficiency across its own fleet has to fill the gap.
The same delay showed up in capex. Q1 capex including finance leases was $45.2B, short of the "over $50B" guide, because third-party capacity deliveries expected in the quarter came late. Q2 is guided over $50B again, and calendar-year spend is now about $170B instead of about $175B. Roughly three quarters of Q1 capex went to short-lived assets, mainly CPUs and GPUs, and Hood called out higher memory and storage costs inside that.
Our four questions for the call:
C1 December-quarter Azure guide: answered. 49–50% cc. Demand still exceeds supply.
C2 Capex including finance leases: partly answered. $45.2B, finance leases $7.4B, cash paid for PP&E $39.4B. How much spending moved to operating leases wasn't quantified.
C3 Why commercial RPO stopped growing: answered. RPO usually falls in Q1, and one large Azure commitment made this quarter's dip smaller. Commercial bookings fell 12% against last year's large Azure deals.
C4 Operating margin: partly answered. Q1 came in near 50%, up slightly. Q2 is guided down slightly year over year. No full-year number.
Two more from the call. Higher-than-expected token pricing helped Azure's Foundry revenue more than triple. And asked how Microsoft would fund the buildout, Hood listed leasing, debt markets it hasn't tapped yet, and other options "when they make sense", while saying FY27 free cash flow stays positive.


$MSFT
Azure did $33.2B in the September quarter, up 48%. Microsoft guided 44–45% in July, so it came in 3–4 points above its own guide, in the first quarter it reports Azure in dollars.
Revenue $92.3B, up 19%, vs $90.7B consensus and an $89.85–90.95B guide. Non-GAAP EPS $4.89 vs $4.72 consensus and $4.13 a year ago. Agents and Infra $76.8B, up 25%, above its $75.15–75.75B guide. Devices and Consumer $15.5B, down 3%, above its $14.7–15.2B guide. Operating margin 49.8%, up from 48.9% a year ago.
Our five questions from yesterday:
Q1 Azure vs 44–45% and $32.2B: answered. 48% and $33.2B.
Q2 Capex vs "more than $50B": partly. Cash paid for property and equipment was $39.4B, up from $35.8B in June. The figure including finance leases comes with the CFO commentary.
Q3 Commercial RPO: answered on size, not on mix. $677B, up 73% from a year ago, but flat with June's $678B. Who added and who didn't isn't in the release.
Q4 Margin flat while capex grows 40%+: answered. Margin rose about 0.9 points.
Q5 December-quarter Azure guide: on the call.
For the 5:30pm ET call:
C1 December-quarter Azure guide, and whether growth still accelerates through the first half as Microsoft said in July.
C2 Capex including finance leases, and how much moved to operating leases under the new accounting.
C3 Why commercial RPO stopped growing quarter on quarter.
C4 Full-year operating margin with Azure running ahead of plan.


$GOOGL
Google Cloud's margin held at 36.2% in Q3 because the rented compute barely showed up yet. On the call, management said the third-party "bridging" capacity came online only at the very end of the quarter, usage ramps in Q4, and that means margin headwinds in the near term.
So for anyone asking what this means for the neoclouds: Google is renting more outside compute this quarter, not less.
Our four questions for the call:
C1 Cloud backlog and the TPU share: partly answered. Backlog rose to $561B from $514B in Q2, mostly typical GCP contracts, and just over 55% should turn into revenue within 24 months. No TPU split. TPU system sales keep scaling in Q4, with a meaningful revenue ramp in 2027. Google now also sells TPU systems through Oracle and a joint venture with Blackstone.
C2 Capex: partly answered. The $195–205B full-year guide is unchanged, so Q4 has to come in at $63–73B after $51.4B in Q3. 2027 capex will "increase significantly", with numbers on the Q4 call. Nobody asked why Q3 came in light.
C3 Third-party compute: answered. Online at the very end of Q3, ramping in Q4, a margin headwind near term.
C4 ATM and new notes vs 2027 capex: not answered, and nobody asked. Management said ROIC stays well above the cost of capital while free cash flow stays under pressure from capex and TPU inventory. Cash and marketable securities ended at $265.1B, long-term debt at $125.1B.
Two more things from the call. Search growth slowed to 12% from 17%, and FX was the single biggest reason, along with a World Cup-heavy June and AI Mode queries that still earn less. Google is now taking ads in AI Mode international and expects lapping last year's acceleration to cost a couple of points again in Q4.
And the TPU inventory that dragged on Q3 cash flow is only built after a contract is signed, so it's already sold.


$GOOGL
Google Cloud did $30.7B in the September quarter, double a year ago, and its operating margin went up, to 36.2% from 35.6% in Q2. In July Alphabet had warned that renting third-party compute would put mild pressure on that margin.
Alphabet revenue $127.6B, up 25%, a little under the $128–132B range of consensus estimates. Operating income $40.6B, up 30%, margin 31.8%. EPS $2.12 vs $2.87 a year ago: other income swung to an $8.2B loss from a $12.8B gain, so operating income is the cleaner read. Search & other $63.4B, up 12%.
Our five questions from yesterday:
Q1 Capex vs the $57–62B a quarter the full-year guide implies: answered. $51.4B, below that range. Year to date is $132.0B, so hitting $195–205B now needs $63–73B in Q4. No 2027 number in the release.
Q2 Cloud margin vs 35.6%: answered. 36.2%.
Q3 Cloud backlog vs $514B: not in the release, left for the call.
Q4 Search growth vs Q2's 17%: answered. 12%, against last year's tougher comparison. Alphabet says query growth is the fastest in five years.
Q5 Free cash flow and the ATM: answered. FCF -$9.1B, after -$5.9B in Q2. Alphabet sold $12.4B of stock through the ATM in the quarter with $27.6B left, and raised $28.7B in new notes.
For the call:
C1 Cloud backlog, and how much of it is TPU systems.
C2 Whether the capex shortfall is delivery timing or a lower full-year number, and the 2027 figure.
C3 How long third-party compute stays in the cloud cost base.
C4 How the ATM and the new notes fit the 2027 capex plan.

