

Founder @WeatherOptics | Building the weather intelligence layer for modern enterprises | Entrepreneur | Weather nerd
New York City, NY
Joined March 2014
- Tweets1K
- Following149
- Followers884
- Likes285

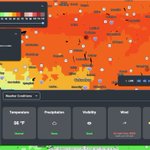




🌬️ High wind gusts of 50-70 mph across the Midwest today are already causing semi-truck rollovers.
As a result, 7 states are currently under High Wind alerts from the National Weather Service.
While this is appropriate for the general public, for trucking companies, that usually means broad warnings or shutting down operations entirely.
The problem is, weather doesn't work in state-sized polygons.
The wind capable of tipping a semi doesn't hit all 7 states at the same time.
It moves through specific corridors and shifts over time, sometimes last only a few hours or across certain stretches..
🚛 That's why why built the Vehicle Tipping Index at @weatheroptics..
1
1
347
The Tipping Index is an AI-based Impact Model – it generates predictive and real-time probabilities of a tipping event at the individual vehicle level.
This allows fleets to:
→ Alert only the drivers actually at risk
→ Avoid unnecessary multi-state shutdowns that may cost $ millions in operational expenses
→ Give dispatchers clear, localized guidance

1
76
🚨 Not all risk is the same when it comes to weather interacting with the real-world.
High winds or heavy snowfall or significant rain can impact transportation in very different ways based on contextual and environmental factors:
→ How often does this weather conditions happen where the vehicle is?
→ What are the specific vehicle attributes? Weight, height, speed, direction, etc.
→ What's the surrounding topography? Curvature of the roadway?
So many non-weather factors have a significant affect on how that vehicle is impacted by the weather.
And that's what makes something like the Tipping Index important for trucking companies that care about the safety of their drivers and ensuring product gets from Point A to Point B.

60
❄️From 75 degrees and sunny to heavy wet snow in <24 hours in Downtown Brooklyn — what a crazy turnaround.
On and off moderate to heavy snow showers likely to persist for the next few hours before tapering off.
Doubt we get anything sticking here.
Parts of Virginia are reporting 2+ inches of snow after hitting close to 90 yesterday! 🤯
@LeeGoldbergABC7 @burgwx @NWSNewYorkNY @NycStormChaser @AllanWeather @WeatherNut27
1
6
397
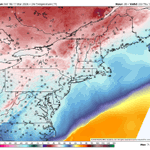
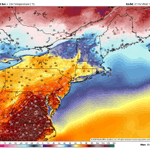
Insane whiplash likely tomorrow across the Mid-Atlantic where temperatures will go from nearly 90 degrees to the mid-30s with heavy snow in <24 hours.
Left image shows high temperatures from earlier today with widespread 70s and 80s from Richmond to NYC.
Right image shows the simulated radar from the HRRR at 4 PM with widespread heavy snow across a large portion of the Mid-Atlantic, including DC, Philly, and NYC.
Wild stuff, even for March.


1
332
Temperatures will remain mostly above freezing as rain changes over to heavy wet snow – so any meaningful accumulation is not expected.
However, rates may be heavy enough as the sun lowers during the late afternoon and evening hours to accumulate on grassy surfaces.
❄️Can't rule out a slushy inch or two.

95
Scott Pecoriello retweeted

2:15pm: Here is a preliminary snowfall analysis map for the February 22-23, 2026 blizzard from reports we have received so far. For a listing, see the following link: partnerservices.nws.noaa.gov…

Significant tree damage with a few side roads blocked in parts of Downtown Brooklyn.
Talked to this gentleman who said multiple parts of this tree snapped under the weight of heavy wet snow as he was driving through.
Luckily he avoided injury and damage to his vehicle.
Seeing a lot of similar reports, especially closer to the coast where wind gusts are higher.
This also marks at least 8 total hours where snowfall rates were at least 1"/hour or higher for the NYC metro area – the duration and intensity of the storm has been wild.
Very few storms produce at this level for this amount of time.

❄️ We've officially hit the 20” mark at 1:00 PM ET in Downtown Brooklyn. Incredible. We're also experiencing some of the heaviest snowfall rates so far.
One final push of this surreal deformation band could drop another 1-3 inches before all is done.
Here's how the storm has shaped up in Downtown Brooklyn over the last 18 hours:
Yesterdays hourly snowfall count:
6:00 PM ET: 1.5”
7:00 PM ET: 3.2” (1.7”/hour)
8:00 PM ET: 4.7” (1.5”/hour)
9:00 PM ET: 6.2” (1.5”/hour)
10:00 PM ET: 8.2” (2.0”/hour)
11:00 PM ET: 9.7” (1.5”/hour)
12:00 AM ET: 10.4” (0.7”/hour)
Today's hourly snowfall count:
9:00 AM ET: 14.0" (averaged ~ 0.5"/hour overnight)
10:00 AM ET: 16.0" (2.0"/hour)
11:00 AM ET: 17.0" (1.0"/hour)
12:00 PM ET: 17.8" (0.8"/hour)
1:00 PM ET: 20.0" (2.2"/hour) 🥇
Newark Airport reporting 26" of snow as of 2 hours ago.. good chance of breaking 30"!
Will rank as one of the greatest snowstorms of all-time for the region.
@NWSNewYorkNY @NycStormChaser @AllanWeather @nymetrowx @LeeGoldbergABC7 @MikeMasco @burgwx @JimCantore @WeatherNut27


7
862
❄️ We've officially hit the 20” mark at 1:00 PM ET in Downtown Brooklyn. Incredible. We're also experiencing some of the heaviest snowfall rates so far.
One final push of this surreal deformation band could drop another 1-3 inches before all is done.
Here's how the storm has shaped up in Downtown Brooklyn over the last 18 hours:
Yesterdays hourly snowfall count:
6:00 PM ET: 1.5”
7:00 PM ET: 3.2” (1.7”/hour)
8:00 PM ET: 4.7” (1.5”/hour)
9:00 PM ET: 6.2” (1.5”/hour)
10:00 PM ET: 8.2” (2.0”/hour)
11:00 PM ET: 9.7” (1.5”/hour)
12:00 AM ET: 10.4” (0.7”/hour)
Today's hourly snowfall count:
9:00 AM ET: 14.0" (averaged ~ 0.5"/hour overnight)
10:00 AM ET: 16.0" (2.0"/hour)
11:00 AM ET: 17.0" (1.0"/hour)
12:00 PM ET: 17.8" (0.8"/hour)
1:00 PM ET: 20.0" (2.2"/hour) 🥇
Newark Airport reporting 26" of snow as of 2 hours ago.. good chance of breaking 30"!
Will rank as one of the greatest snowstorms of all-time for the region.
@NWSNewYorkNY @NycStormChaser @AllanWeather @nymetrowx @LeeGoldbergABC7 @MikeMasco @burgwx @JimCantore @WeatherNut27
🌀 We're witnessing meteorological perfection this morning as a powerful blizzard dumps 1-3 feet of snowfall and 40-70 mph wind gusts along the most densely populated portion of the I-95 corridor.
This is the kind of meteorological feat that makes its way into textbooks and inspires a new generation of atmospheric scientists to join the field.
No notes on this setup.
The storm is peaking right now with NYC to Boston getting the worst of it.
When all is done, highest totals will exceed 3 feet in some spots.
4
10
670
🎯 Who hits the jackpot with this blizzard? This area right here.
Just an absurd deformation band dropping snowfall rates of 2-4 inches/hour across parts of Rhode Island and SE Massachusetts where some spots are already reporting 24” of snowfall!
Winds are also gusting 40-60+ mph.
This band has not budged for 4+ hours and doesn’t look to be going anywhere soon.
❄️ Someone in this zone will see 30-40 inches of snowfall when it’s all done. Easily.
Unbelievable and record breaking for this corridor.
❄️ 16.0” of snowfall at 10:00 AM ET in Downtown Brooklyn – localized higher totals in the 17-18" range that I've measured in the area. Snow drifts as high as 31" in spots.
Snowfall rates were steady overnight but are now peaking again as a stubborn and powerful deformation band sits of eastern NJ and parts of NYC metro. Some places reporting 18-24" already to my west.
Yesterdays hourly snowfall count:
6:00 PM ET: 1.5”
7:00 PM ET: 3.2” (1.7”/hour)
8:00 PM ET: 4.7” (1.5”/hour)
9:00 PM ET: 6.2” (1.5”/hour)
10:00 PM ET: 8.2” (2.0”/hour) 🤯
11:00 PM ET: 9.7” (1.5”/hour)
12:00 AM ET: 10.4” (0.7”/hour)
Today's hourly snowfall count:
9:00 AM ET: 14.0" (averaged ~ 0.5"/hour overnight)
10:00 AM ET: 16.0" (2.0"/hour) 🤯
Expecting several more hours of snowfall rates 1-2+ inches per hour.
I think NYC easily breaks 20" before all is done. Areas just west towards Elizabeth and Newark NJ will likely see 24-36 inches!
@NWSNewYorkNY @NycStormChaser @AllanWeather @nymetrowx @LeeGoldbergABC7 @MikeMasco @burgwx @JimCantore


Scott Pecoriello retweeted

12:30am: Getting several reports of THUNDERSNOW in NYC over the last few minutes!!
⚡️⚡️THUNDERSNOW confirmed in NYC metro — big flash facing north from Downtown Brooklyn accompanied by a low rumble.
Extremely dynamic system and these deformation bands mean business.
Wouldn’t be surprised if more lightning activity picked up overnight.
❄️ 10.4” of snowfall at 12:00 AM ET in Downtown Brooklyn.
Snowfall rates have relaxed as the core deformation band sits just off to our west. This should be temporary.
Winds have increased though — heavy wet snow, but trees are shaking and snow is still blowing. Gusts around 30-35 mph.
6:00 PM ET: 1.5”
7:00 PM ET: 3.2” (1.7”/hour)
8:00 PM ET: 4.7” (1.5”/hour)
9:00 PM ET: 6.2” (1.5”/hour)
10:00 PM ET: 8.2” (2.0”/hour)
11:00 PM ET: 9.7” (1.5”/hour)
12:00 AM ET: 10.4” (0.7”/hour)
We had 5 consecutive hours of snowfall rates > 1.5”/hour 🔥
Worst of the storm still expected between 2 AM and 6 AM.
Next check in we’ll have the yardstick out 👀
@NWSNewYorkNY @NycStormChaser @AllanWeather @nymetrowx @LeeGoldbergABC7 @MikeMasco @burgwx @JimCantore

Hang it in the louvre – remarkable satellite imagery of our blizzard rapidly intensifying offshore and throwing back widespread 1-2 feet of snowfall along with hurricane force wind gusts.
This is a near perfect, textbook example of how the most densely populated portion of the I-95 corridor gets slammed by a blizzard.
When all is done this is one that will be remembered for a long time.
⚡️Power outages are quickly rising along the eastern seaboard as wind gusts begin to crank. A few counties across the Delmarva now showing 10-20%+ of customers without power.
Hardest hit counties as of 11:00 PM ET:
🟣1. Accomack County, VA: 21% without power
🟣 2. Sussex County, DE: 15.8% without power
🟣 3. Northumberland Co, VA: 15.47% without power
⚪️ 4. Worcester County, MD: 6.1% without power
⚪️ 5. Ocean County, NJ: 3.9% without power
We're still hours away from the strongest winds and heaviest snowfall as our blizzard counties to strengthen, so expect these numbers to keep ticking upwards.


Where are outages most likely to increase over the next 12-18 hours? The @weatheroptics Power Outage Index is designed to predict exactly this at a highly granular level.
The index leverages our AI weather model HYPERR alongside key environmental, geospatial, local infrastructure, and historical outage data to forecast what % of customers are likely to lose power down to 3km granularity.
Snapshot at 4 AM ET Monday shows eastern Long Island, parts of CT, RI, and eastern MA are most at risk. Outages may look low/scattered, but these light purple shades represent up to 20% of customers losing power.

2
426