

RF Test & Measurement Equipment Engineered for Engineers. 🔔 Subscribe at https://xitter.cf/t.co/XMV57qW8Ox
- Tweets3.1K
- Following265
- Followers2.1K
- Likes2.2K
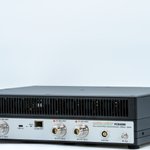







ALT A Signal Hound VSG200 vector signal generator is displayed against a white background. The front panel features various controls, including a power button and connections labeled "Trigger Out" and "RF Out 50Ω." Indicator lights labeled "Ready" and "Busy" are visible.

ALT A Signal Hound VSG2000 vector signal generator. It features a ribbed, rectangular design with ports and logos on the front panel. The device is black with white labeling and includes USB connectivity.

ALT Signal Hound SM200B and Signal Hound VSG200 devices on a table, with cables connected. A monitor in the background displays a graph.

ALT Graph showing "Amplitude Accuracy vs. Frequency" for two units at -20 dBm CW. Frequency is on the x-axis, ranging from 0 to 20 GHz. Amplitude Error, in dB, is on the y-axis, ranging from -0.6 to 0.2. Two lines represent different units: one in blue and one in red, showing variations in amplitude error across the frequency range.

ALT The image shows a Signal Hound PCR4200 phase-coheren receiver, featuring multiple input and output connectors on the front panel. It has a black top and a white base with various labeled ports and sits at an angle on a white surface.

ALT A Signal Hound PCR4200 with multiple connectors labeled as "10 MHz In," "10 MHz Out," "Local Oscillator Out," "Sync Out," "1PPS Out," and "GPS Antenna" on its rear panel. The unit is primarily black and gray with a rectangular shape.

ALT The image shows a Signal Hound PCR4200 on a blue workbench. The analyzer features multiple ports for connecting cables. Behind the device, a computer screen displays graphs and data, likely related to signal analysis.

ALT A person stands next to a VNA400 setup at a demonstration booth. A computer monitor displays waveform data. The backdrop includes the text "VNA400: 40 GHz Demo.

ALT A Signal Hound BB60D real-time spectrum analyzer is on a blue surface in front of a computer monitor displaying frequency data.

ALT The vertical axis represents noise floor in dBm/Hz, ranging from -167 to -157. The horizontal axis represents frequency in GHz up to 6 GHz. The data shows various fluctuations, with a general upward trend starting around 4 GHz.

ALT A rectangular electronic device is shown with a focus on its connections. It features a 5V 2A power input, a USB 3.0 port, a 10 MHz reference input/output, and a 1‑PPS trigger/sync connector. The device is marked with CE and UKCA symbols.

ALT A small electronic device featuring labeled LED indicators and connectors. The front panel shows "READY" in green, "BUSY" in red, and "INPUT 50Ω". It also displays a caution symbol with the text "15 VDC <500mA MAX".

ALT A graphic for the AOC 2026 International Symposium & Convention. Features a colorful circular radar design on the left, with "AOC 2026" and event title on a dark, contour map background.


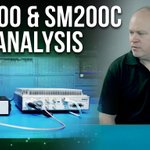
ALT An electronic device labeled "Signal Hound SM200C" is in the foreground, featuring various ports and cables connected. In the background, a person is seated at a workstation with multiple electronic testing equipment.


ALT This image is a graphic with a green background featuring a white zigzag line resembling a pulse, accompanied by circular lines in the top right corner. The text "Pulse Analysis" is written below the line.

ALT A computer screen displaying a complex data analysis software interface with multiple charts and graphs. The panels show various waveforms, spectrum analysis, and settings options. A green and yellow heatmap is visible with red markers. Tables with numerical data are at the bottom.

ALT Four graphs display various signal analyses on a computer interface. The upper left graph shows a multicolored amplitude vs. time analysis. The upper right graph displays FM vs. time. The center contains a "Measurement Properties" window showing settings for deinterleaving and correlation, with frequency and emitter details. The lower left graph illustrates pulse view for FM signals, and the lower right graph shows pulse history with rise time. The layout suggests advanced signal processing data.

ALT Graphical user interface displaying multiple waveform and spectral graphs, data tables, and analysis settings. Upper sections include views of pulse amplitude over time and power spectrum plots. The lower section shows data tables with numerical values. Various control settings are visible on the right side, facilitating detailed waveform and spectral analysis.
