


YOUR BACKYARD COULD BE PAYING YOUR MORTGAGE. CLAUDE DREW THE HOUSE THAT DOES IT.
Since California legalized backyard homes, ADU permits jumped 150x and now make up almost 1 in 5 new homes there. A 1 bedroom ADU in the LA area rents for about $2,000 to $2,800 a month and costs roughly $80,000 to $120,000 to build, so it can pay for itself in around 5 years.
Claude Opus 5.5 drew one: a 20' x 20' home on a regular 50' x 125' lot. It started with the property line, placed the house 4 feet off the side and rear lines, squeezed in a parking spot and ran sewer, water and power back to the main house. Then it drew the actual home: 2x6 walls, a bedroom, a bath with laundry, a kitchen, smoke and CO alarms, every dimension in feet and inches, and a full sheet with the site plan, room schedule and notes.
It even sized the bedroom window as an emergency exit: big enough to climb out of, sill at 32" off the floor where code allows 44" max.
It's a schematic, so a real permit set still needs energy calcs (Title 24 in California), sometimes an engineer, and city plan check.
But the first draft of a backyard rental now takes a prompt, not a week.
MY BRAIN STILL CAN'T PROCESS THIS. AI JUST PIPED AN ENTIRE MALL OF AMERICA.
Claude Opus 5.5 took a building the size of Mall of America and did the entire MEP by itself. 504 stores, six 2,000-ton chillers, 33 miles of duct, 131 miles of pipe and 31,008 sprinkler heads spaced to NFPA 13. Storm drains, kitchen exhaust, backup generators, all of it. 111,641 elements in total, modeled in a Revit-style workspace.
Then it ran a clash check on its own work. It found 21 spots where storm pipes cut through chilled water, sprinkler and sanitary lines, rerouted them and checked again. Zero clashes.
The building is approximate and the systems are Claude's own design. No engineer has reviewed it.
Would you let AI coordinate your next project?
Hey @grok, what would you do better than Claude here?
I asked Claude Opus 5.5 to build a rover from scratch in Blender, the way a real 3D artist would. This is what it made.
A fully rigged machine: 35,274 vertices, six wheels with 36:1 planetary gearboxes inside, rocker-bogie suspension, a 5-joint arm and a camera mast. It all moves. Lift one wheel and the other five stay on the ground. Steer, and it turns on the spot.
Oh, and that Blender interface? Claude built it too, right in the browser, cursor and all.
So is there a real future for AI in 3D?
I FOUND THIS OLD DRAWING ONLINE AND I HAVE NO IDEA WHAT IT IS!
It's labeled just Fig. 8. No name, no description, only a few dimensions: 31", 42", 15" and 21". So I fed it to Claude Opus 5.5 and asked it to show me how it would draw this in CAD and then turn it into a moving 3D model.
It went command by command like a drafter would, with LINE, CIRCLE, OFFSET, TRIM, FILLET, HATCH and dimensions, then extruded the parts and set the whole thing in motion. Along the way it worked out how it holds together. Three equal links, 25" long and leaning 24°, carry a beam on pins 31" and 42" apart. Since they're equal and parallel, the beam slides without tilting and needs no guides. An eccentric disc set 3" off the shaft works like a crank without a crankpin and pushes a rod into a drop arm 15" from the middle pivot.
And no, Claude doesn't know what it was for either. It told me so and even flagged what it had to guess, like where the pulley sits and how far the beam swings, since the drawing hints at a much bigger stroke than the 6.44" in the video.
Does anyone know what this machine actually did?

AI CAN ALREADY DO THE MEP FOR A WHOLE HOUSE. LOOK AT THIS!
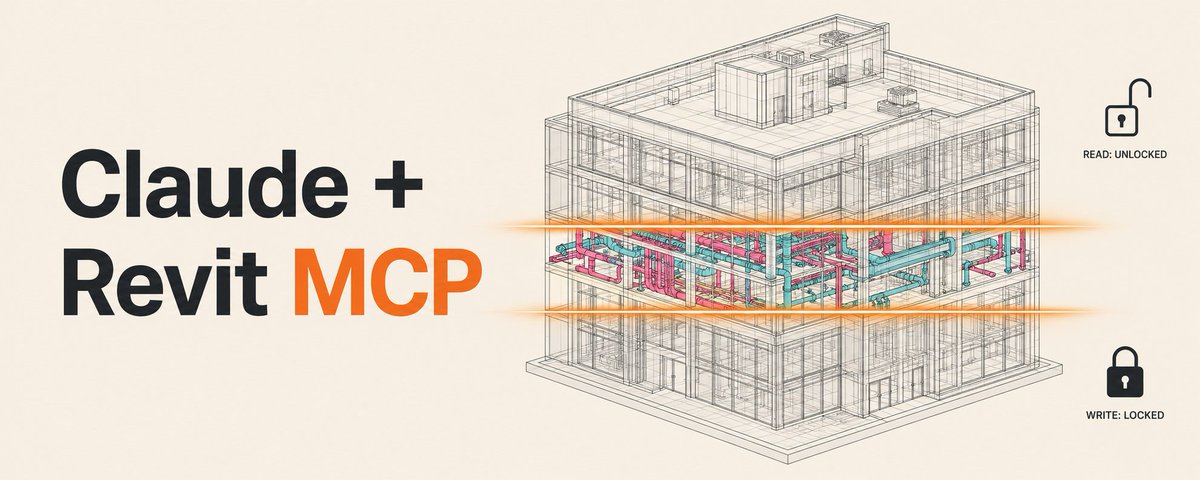
The task was a two-story villa with heating and cooling, plumbing, fire sprinklers and lighting, all to US code and shown the way you'd model it in Revit. Claude Opus 5.5 placed the equipment, routed and sized the ducts, ran the pipes and checked everything against the structure. In the end that's 286 ft of duct, 1,006 ft of water lines and 20 sprinkler heads.
What gets me is that it knows the actual workflow and why things go where they go. When the check found a duct going through a beam, it fixed it the way an engineer would, dropping the duct into a soffit under the beam.
It's a Revit-style scene built from scratch, not a real Revit file, and no engineer stamped it. But the tools and the order are the real ones, so you can follow the same workflow in actual Revit. A year ago AI couldn't get close to this.
MEP folks, what would you flag first?
HOW ABOUT THIS ONE? THIS IS INSANE!
Claude Opus 5.5 laid out a whole 11.9 MW solar farm on 59 acres and then built it in 3D: survey, site boundary, panel rows, roads, cables, inverter stations. It's all one HTML file it wrote, the CAD screen included.
I only gave it the task. The engineering it worked out itself. Panels give more voltage in the cold: on the coldest morning the site is designed for, −15 °C (5 °F), each one gives 57.5 V, and the inverter takes 1,500 V at most. So it put 26 panels on a string, 1,496 V, just under the limit. That's the same check the US electrical code asks for. It also kept a 40 m strip clear under an existing power line.
Then one click filled the site: 383 rows that turn to follow the sun, 20,436 panels, 3,527 steel piles, 39 combiner boxes and two 4.4 MVA stations. The rows stand 5.7 m apart, and at sunrise they stay flatter than the sun on purpose, because tilted all the way each row would shade the one behind it.
I'll keep testing what else it can design. At the very least, it looks cool.
CLAUDE OPUS 5.5 DREW A 92 M² APARTMENT FROM A SINGLE GRID LINE, THEN BUILT IT IN 3D.
No AutoCAD here. The CAD screen, every command and the 3D model are one HTML file it wrote.
What makes it worth watching is the order, the one a real drafter follows. Grid first, with bays of 4.2, 3.6 and 4.2 m, because everything hangs off these lines. Then one 400 × 400 mm concrete column, copied to every crossing. Outer walls next: 300 mm block with 150 mm of insulation outside.
After that come doors and windows, then furniture at real sizes, so you can see if a door swings into the bed. Dimensions, room areas, a 1:50 sheet. Then one selection window, and the walls rise to 2.8 m.
Useful tool or just a nice demo?
ONE BLADE OF THIS TURBINE IS LONGER THAN A FOOTBALL PITCH.
115.5 m. The three blades sweep a circle the size of about six football pitches. One turbine makes around 80 GWh a year, enough for more than 20,000 homes.
It's the Vestas V236-15 MW. Baltic Power, one of Poland's first offshore wind farms, puts 76 of them in the sea about 23 km off the coast. Claude Opus 5.5 rebuilt how one gets installed, step by step, in a single HTML file.
Here's roughly how it goes:
Gravel goes onto the seabed first, so currents can't wash the sand away from the foundation.
A steel tube over 9 m wide and up to 120 m long gets hammered into the seabed.
A ship lowers four legs and lifts itself out of the waves, because the crane needs a deck that doesn't move.
Then the tower, the machine housing on top, and the blades, one at a time.
A 57,000-TONNE CONCRETE TUNNEL CAN FLOAT.
That's how the undersea tunnel between Copenhagen and Malmö was built. Claude Opus 5.5 rebuilt the whole process in 3D, in a single HTML file.
The tunnel is 20 giant concrete boxes, each 176 m long. They were cast on land, 8 sections per box, about 30 hours per section.
Close both ends with steel walls, flood the dock, and the hollow box floats like a ship. Four tugs tow it out to sea. Then water is pumped into tanks inside it, and it sinks into a trench dug in the seabed.
The clever part is the joint. Jacks pull the box against the one already in place until a rubber seal touches. Then the water trapped between them is pumped out, and the sea pressing on the far end does the rest. It pushes the box tight.
In August 1998 one of those steel walls gave way, and a whole box flooded in seconds. Fixing it took eight weeks.
IN 1854, ELISHA OTIS HAD THE ONLY ROPE ABOVE HIS PLATFORM CUT WITH AN AXE. IT DROPPED A FEW INCHES AND STOPPED.
Every modern rope elevator still runs on that idea, stacked in layers:
Power cuts out: springs clamp a brake on the motor. It has to hold the car loaded to 125% of its limit.
A rope breaks: the others carry the car. Code requires at least 3 ropes, together at least 7.6 times stronger than they need to be.
Every rope snaps: a speed sensor called the governor trips at 115% of normal speed, and steel wedges grab the rails.
The car overshoots the bottom floor: oil-filled buffers in the pit soften the hit.
Claude Opus 5.5 built this whole scene in one HTML file, including the MP4 render.
A 118 M CONCRETE SPAN, BUILT SEGMENT BY SEGMENT IN MID-AIR. ONE CHAT, ONE HTML FILE.
Claude wrote the whole scene: piers, form travelers, 13 segment pairs per pier, camber, closure pour, deck. About 500 lines of code, zero 3D models.
It got the engineering right:
The arms grow in pairs, so the pier stays balanced.
The girder is 7 m deep at the pier, where bending is highest, and 3 m at midspan.
The tips are cast high, because the arms deflect and concrete creeps for years.
A crew pours roughly one segment pair a week, and the scene counts the weeks.
Where this helps: showing a build sequence before anything exists on site.
Where it falls short:
It's a schematic. Camber is exaggerated for the eye, and nothing here is calculated for load or creep.
THIS METRO TUNNEL SCENE IS A SINGLE HTML FILE. ABOUT 600 LINES OF CODE, ZERO 3D MODELS.
Claude wrote all of it from a chat: the machine, the rings, the soil layers, the camera path, the captions, even the 4K MP4 export that runs in the browser.
My part was the brief and the checking. Every key figure was checked against London's Crossrail tunnels: 7.1 m shield, rings of 7 segments plus a key, about 100 m a week.
Where it shines:
You can now visualize pretty much anything this way. A device, a process, a physical effect. An elevator, a wind turbine, a fire pump, a power grid.
Where it falls short:
First drafts needed fixes. Wrong details, jumpy camera, captions covering the scene.
It checks its work with screenshots and scripts, so spotting flicker and other motion issues is on you.
It's a schematic, no substitute for the ground calculations and drawings an engineer signs off.
12,470 VOLTS COME IN FROM THE STREET. 120 COME OUT OF YOUR DESK OUTLET. HERE'S WHAT HAPPENS IN BETWEEN
5 stops in a typical US office building:
1. A transformer outside: 12,470 V down to 480 V
2. The main switchboard: the master breaker for the whole building, 2000 A
3. A metal power "spine" runs up the building and taps into every floor
4. A smaller transformer on your floor: 480 V down to 120 V
5. A 20 A breaker and a copper wire to your outlet
Why not send 120 V from the start? Same power at lower voltage means more current, and more current needs thicker copper. 4x the voltage, a quarter of the current. So power travels at high voltage and drops only at the last step
Fun detail: in many offices the outlet plate has a label like RP-5-7. Panel on floor 5, circuit 7. That's how an electrician finds the right breaker without flipping all of them
Ratings are a typical example, every building is sized differently
A TOASTER CATCHES FIRE ON FLOOR 32. THIS IS WHAT THE BUILDING DOES ON ITS OWN.
Claude built it as one continuous shot: a fictional office tower running real US fire protection logic.
Engineers call this the sequence of operations:
Smoke detector trips
Alarm on floors 31, 32 and 33
Air handlers stop, smoke dampers close
Stairs pressurized to 25-87 Pa
Bulb bursts at 68°C, one head opens
Flow switch tells the panel which floor
Fire pump starts on the pressure drop
NFPA data: in 80% of US fires where wet sprinklers operated, only one head opened.
Every floor of a high-rise gets its own supervised valve (IBC 903.4.3). That is how the panel knows the exact floor.
On real projects this sequence lives in a spreadsheet matrix and a stack of riser diagrams. Owners, facility teams and junior engineers struggle to picture it. A one-minute walkthrough makes it click.
CLAUDE OPUS 5.5 JUST BUILT THE BURJ KHALIFA WITH ITS MEP INSIDE. 21,133 ELEMENTS, AND IT OPENS IN A BROWSER TAB.
Core walls, outriggers, 57 lift cars, supply ducts floor by floor, 12,756 sprinkler heads, chilled-water loops, cable trays, 194 piles under a 3.7 m raft. Each system sits on its own layer and switches on like a filter in Navisworks.
The figures are public ones: 828 m, 163 floors, 7 double-height plant floors, 946,000 litres of water a day. The routing between them is schematic, because the real BIM model of the Burj isn't public.
What gets me is the format. A federated model this size usually means a heavy file, a desktop viewer and someone who knows how to drive it. Here a client, a facility manager or a student opens a link and sees how the systems of a supertall stack up.
My guess is this won't replace Revit or Navisworks anytime soon. It could become a handy extra though: a quick link to walk a client or a new team member through the systems before anyone opens the real model.
Where would something like this actually help on your projects?
I GAVE CLAUDE OPUS 5.5 ONE FLOOR PLAN FROM 1931. 30 MINUTES LATER IT HAD REBUILT THE WHOLE THEATER IN 3D, ALL 3,476 SEATS
Neon sign and marquee, Grand Lobby with the green glass ceiling, three balcony tiers, ceiling grille, stage and curtain. One message, runs in a browser tab.
Orchestra: 1,796 seats
Balcony: 1,680 seats
Geometry: 279,000 triangles, 23 draw calls
Camera: one 30 second move, no cuts
Video: 1,800 frames at 1440p, 8 renders per frame
The building is the Paramount Theatre in Oakland, opened in 1931 for $3,000,000. The plan is sheet 2 of the architects' original drawings, from the Historic American Buildings Survey at the Library of Congress. Original plan in the replies.
A plan only gives the footprint. Heights come from the National Historic Landmark file (90 ft auditorium, 100 ft facade), finishes from public photos. Treat it as an illustration, nobody measured anything on site.
The fun part is that almost any old building kept on plans and drawings can come back as a scene you can explore from every angle. This theater is just the first. HABS alone holds 72,828 sheets of measured drawings, most of them public domain.
This is the first version, zero edits. How would you rate it out of 10?

20 RACKS. 1,440 GPUs. HOW MANY US HOMES WORTH OF POWER DOES THIS ROOM DRAW?
About 2,000.
3D build of a small liquid-cooled AI hall. Illustrative, 20 racks of NVL72-class (72 GPUs per rack).
Each rack pulls roughly 120 kW. A typical colocation rack is 8-15 kW. One of these = 8-15 normal ones.
Air can't pull that much heat out of such a small box. So cold plates sit right on the chips and liquid does the work.
Rough math:
2.4 MW at full load, 24/7 = ~21,000 MWh a year
At $0.08/kWh (assumed) = ~$1,700,000 a year in electricity
Racks alone, reported ~$3,000,000 each = ~$60,000,000
The scene itself was made by prompting Claude Opus 5.5 in plain text. No Blender, no 3D software. It runs in the browser (Three.js) and the result is one link that opens on any laptop or phone. Changing it takes one message: "make the row shorter", "add a cooling loop".
Useful at concept stage: show a client how racks, power and cooling fit in a room before anyone opens Revit. Same approach works for a plant room, a pump station or a warehouse layout. It is a sketch you can walk through. Real design still lives in BIM.
CLAUDE DREW A TWO FLOOR HOUSE IN AUTOCAD: 524 ELEMENTS IN 88.6 SECONDS.
Both floors, the front elevation, the title block, notes, and the door and window schedules, all from a script that drives AutoCAD.
Where the time went:
First floor: 188 elements, 31 s
Second floor: 171 elements, 33 s
Front elevation: 83 elements, 15 s
Title block, notes and door and window schedules: 82 elements, 8 s
The count and timings are Claude's own report of the script run, and nothing in it checks the plans against any building code.
Schedules, notes and the title block took 8 seconds, and that is the repetitive part of drafting.
My guess is that drafting is the first part of the job that turns into a prompt. The thinking stays with the architect: what goes in the house, where the walls go, what the building code says.
Would you hand a client a drawing set made in 88 seconds?
CLAUDE SONNET 5.5 BUILT A 40 FLOOR TOWER WITH 8,934 PARTS IN 15 MINUTES.
One HTML file, 50 KB. It opens in a browser tab and plays 68 seconds of construction: pit, core, frame, pipes and ducts, facade, roof, and the cranes get taken down at the end.
What's in it:
40 floors above ground plus 2 basements, 144 m tall
928 columns, 2,178 beams, 2,576 facade panels, 996 sprinklers
Two tower cranes that climb with the building, plus a hoist on the facade
It's a visual. The build sequence is made up and the geometry is simplified, so nothing here is calculated.
Where it's useful:
Showing a client how their building will go up, in a link they can open on a phone
A visual for a tender or a pitch that stands out next to other people's PDFs
Presenting a building that doesn't exist yet to investors or buyers
With a real model and a real schedule behind it, the same page can show an actual project. And it doesn't stop at buildings. Give Claude real plans, visuals and project data for whatever you need to present, and it can pack them into a 3D scene in minutes.
Where this is going: Claude can already drive Fusion, Revit, AutoCAD and other programs through connectors. My guess is that every modeling program gets a chat built in next. You open it, describe what you need and get drawings, and starting from a blank sheet starts to look weird.
Sounds great for speed. But would you live in a building an AI designed?
