

Systematic trader, fund manager. Web: https://xitter.cf/t.co/Qga9clOPid
Joined August 2022
- Tweets1.6K
- Following94
- Followers10.6K
- Likes27




Pinned Tweet
I’ve been trading for ~30 years.
First half: fully discretionary, living inside futures microstructure. It worked—until algos started exploiting the same patterns and reacting in microseconds. Edge decay was real.
So ~10 years ago I switched to systematic.
Now I run many uncorrelated strategies in parallel without babysitting screens all day. I wouldn’t go back.
My biggest unlock: reusability of know‐how.
When I finish a new system, I plug it into a ready workflow in minutes. It monitors itself; I move my brain to the next big thing.
Here’s the playbook I wish I had from day one:
- Framework (design once → reuse forever)
- Data → clean, feature, label.
- Hypothesis → simple, testable edges (breakouts, momentum, mean reversion).
- Validation → IS/OOS, realistic costs/slippage.
- Risk → position sizing, max heat, portfolio exposure caps.
- Deploy → automated orders, fail‐safes.
- Monitor → health dashboards, kill‐switch rules, mobile app.
- Iterate → new systems slot into the same pipeline.
Principles that compound:
- Many small, independent edges > one “genius” setup.
- Process beats prediction.
- Shipping beats perfecting.
Discretionary taught me markets. Systems gave me scale.
The futures trend-following project I shared a few months ago is now at a new all-time high in paper trading.
A useful reminder if you’re interested in learning how CTA-style futures portfolios work.
Lucas Joly has published his master’s thesis research on GitHub, using a Carver-style framework, alongside an ongoing paper-trading dashboard.
Research + code:
github.com/Lucas-Joly-GH/tre…

You don’t need a course or paid mentor to start learning systematic trading.
An LLM can be a very useful tutor. But you still have to do the work.
I get a lot of questions about how to get started. My suggestion: choose one published strategy with clear rules and results.
Then use an LLM to work through questions like:
• What principle is this strategy based on?
• Why might it have an edge?
• What data do I need?
• What is the simplest version I could test?
Get the data and ask it to help build first prototype.
A second LLM can help audit the code and results. You still need to verify the logic and inspect individual trades yourself.
From there, keep asking about everything you don’t understand.
Have it walk through the calculations. Ask it to build a manual with worked examples of entries, exits and position sizing.
If something is difficult to understand, ask for an interactive dashboard where you can change the inputs and see what happens.
That is a practical way to learn: connect the principle, the code and the behaviour of the strategy.
“Help me understand and test this strategy” is a much more useful starting point than “build me a profitable system.”
I wouldn’t expect an easy process. But access to explanations, examples and technical help at each step is extremely valuable.
The LLM can help you understand and assemble the building blocks. You remain responsible for the system you eventually build and trade.
Last week was a reminder of how wild long mean reversion on individual stocks can be.
What happens when you trade it on an index instead?
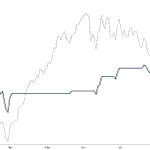
This chart shows a Nasdaq mean reversion system I trade live through a leveraged ETF.
In my experience, it usually behaves more smoothly than my individual-stock versions. The trade-off is lower profits. My version doesn’t beat the index.
I’m comfortable with that. It gives me another return stream, and using a leveraged ETF means it doesn’t tie up much capital.
Do you run mean reversion also on indexes?
In the chart: Black: my system’s equity curve. Gray: QQQ itself.

Friday was difficult for many long mean reversion systems.
But this slower model, which I track publicly for many years, gained on that day.
I found the contrast interesting because it’s easy to put all these systems in the same “buy the dip” bucket.
The main difference here is speed. This model uses RSI on weekly charts across the S&P 500 universe. Nothing complicated.
One day doesn’t prove diversification. But slower timeframes are an interesting direction to test when looking for diversification within long mean reversion.
I track the model’s ongoing performance on Cracking Markets under:
Live Trading Models → Buy the dip (weekly).

LLMs have sent me back to my university maths.
And that’s changing the kinds of trading systems I’m trying to build.
All the systems I currently run are price-based. In some form, they express a view on price direction or momentum. That works, but it has limitations.
I’m not a quant or a mathematician. What I could build was partly constrained by the maths I was comfortable working with.
LLMs are helping me revisit what I learned at university, fill in the gaps, and build on it.
Over the past few months, I’ve been putting that learning into researching systems built around a view on volatility.
It feels like a different world from the systems I’m used to. The appeal is the possibility of adding a very different source of returns to my portfolio.
So far, LLMs haven’t made me work less. I’m working harder than before. There’s just a lot more I want to explore now :)
Friday’s dip in US stocks hurt my long mean reversion systems too.
Drawdowns look much easier when you can already see the recovery on the chart.
But looking at the combined simulated equity curve of these systems I live trade, roughly 4,000 trades, the size and speed of this drawdown were not unusual.
Mean reversion can produce a high win rate, with occasional larger losses. Those losses need to be reflected in the allocation from the beginning. I have hard limits on how much capital all these systems can use together. Their share of my portfolio is limited, and it gets smaller automatically as volatility rises.

Can you build a hedge fund by combining the verified live results of independent traders?
I like the idea. I’m still undecided about how far you can get without understanding the strategies behind those results.
The concept is appealing:
• Give traders a platform to build verifiable track records.
• Select promising traders and strategies.
• Combine them into one portfolio.
• Manage sizing, correlations and risk centrally.
The traders keep their logic private. The allocator evaluates their results.
In theory, you could discover many independent sources of return that would otherwise remain in individual accounts.
I remember how promising Quantopian looked before it closed in 2020. More recently, I’ve been following Darwinex INDX with interest.
These are different implementations, and a drawdown in INDX alone doesn’t invalidate the idea. But they bring me back to the same concern:
How much of the selection process is simply data mining other people’s equity curves?
A verified live record tells you that the results happened. Establishing whether they reflect a repeatable edge is a much harder problem.
A trader can make money for several years through some combination of skill, favourable conditions and luck. Even an honest, disciplined trader may have weaknesses in the strategy that the market has not exposed yet.
Survivorship bias adds another problem: we see the attractive records of those who made it through, while many failed accounts disappear from view.
I see this when talking with traders. Sometimes the equity curve looks convincing, but discussing the actual process leaves me wondering how someone could feel comfortable putting money behind it.
Now select the most attractive records from a large pool and optimise their combination.
You can end up with a beautiful historical portfolio while still knowing very little about why it should keep working.
Different traders don’t necessarily mean different risks. Apparently unrelated strategies may depend on the same market conditions. What looked like diversification in the historical data may turn out to be variations of the same idea, using slightly different indicator settings.
And the selection and allocation process is itself a trading strategy. With limited history and many choices about whom to include, when to replace them and how much to allocate, there is plenty of room to overfit.
I still want the community fund idea to work.
But increasingly, I find myself paying more attention to the thinking and temperament behind the trading: how someone develops ideas, tests assumptions and deals with uncertainty.
Personally, I don’t trade other people’s systems. I need the conviction that comes from doing my own research. That is probably part of why I ended up becoming a trader myself.
But I understand the appeal of allocating capital to other traders. And a “meta-strategy” that combines their performance into a diversified portfolio still strikes me as a very appealing idea.

STP or LMT for breakout entries?
I want to catch the move. But I also care about how much I pay to get in.
A stop or market order prioritizes getting filled once the level breaks. A limit order gives me price control, with the risk of entering later or missing the trade.
That trade-off is worth testing.
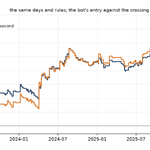
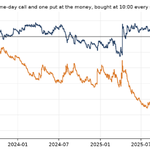
Here is an example from my intraday breakout using 0DTE options:
• Orange: market order when the breakout triggers. Fees included, slippage excluded.
• Blue: limit order in the following minute.
The immediate entry looks better before slippage.
But the slippage on market orders changes the conclusion. In my case, the limit approach works better in practice, especially at larger size.
The interesting part: the signal still has value even when I enter later.

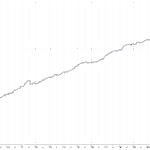
My long mean reversion model (all rules shared) is making a new out-of-sample high.
+35% CAGR with a -10.6% drawdown over the period shown. And average capital use of only 15%.
This is a typical long mean reversion system trading Nasdaq 100 stocks. The same approach also works well on the S&P 500 universe.
Model results for the period shown:
• IBKR fees included
• CAGR: +35%
• Drawdown: -10.6%
• Sharpe ratio: 1.79
• Average capital use: 15%
That last number can create a temptation: make the system trade more.
Loosen the entries. Accept weaker setups. Keep more capital busy.
But every additional trade needs to earn its place. Increasing capital use only helps if those extra trades have an edge worth taking.
I prefer to let the model wait for its setups and combine it with other strategies, such as rotational momentum.
I share 100% of the rules, a detailed breakdown, and a free backtester so you can test variations yourself.

Backtester and deep dive: crackingmarkets.com/buying-s…

Can buying 0DTE options every day be profitable?
I backtested the simplest version: buy 1 ATM SPY call + 1 ATM SPY put at 10:00, then sell just before the bell.
944 trading days (2023 - 2026). $0.70/side fees.
Result: about -$12.7k. Lost money in every year tested.
• Before fees, the strategy lost about 4% of the total premium paid. Fees accounted for 21% of the total loss.
• SPY moved more than the straddle cost on only 38% of days.
• The 10 best days: +$14.6k. The other 934: −$27.2k.
• Calls nearly broke even (−$1.8k); puts lost $10.9k.
A few big days did a lot of the work. They still couldn’t cover the losses from the rest.
The edge, if any, is in choosing the day.

I just added new dedicated research server with 256 GB RAM for €85/month (ex VAT).
Not a VM. The whole machine, including hosting and electricity.
I needed more RAM and enough CPU threads to speed up some of my systematic trading research. Rather than order a new server, I took over an existing Hetzner contract.
The setup:
• Intel Xeon W-2295
• 256 GB ECC DDR4
• 1 TB SSD
Monthly cost: €85 ex VAT.
One-off takeover payment: €120.
Hetzner raised prices for new server orders in June, but left existing server contracts unchanged.
There is a marketplace on its forum where customers offer their dedicated servers for transfer to other customers.
Yes, it is older hardware. But I was looking for plenty of RAM and enough threads for research at a reasonable running cost - not the latest CPU.
For that purpose, this was a good deal for me.
Worth looking through those offers before ordering a new server.
I used to prefer systems that won often.
In recent years, I’ve shifted my portfolio more toward systems that win less often, but have much larger average winners than losers.
I previously favored higher frequency, mean reversion style systems. Frequent small profits felt comfortable. What I’ve become less comfortable with is the recovery process when losses start to cluster. When the average loss is much larger than the average win, you can suddenly find yourself looking at a mountain you have to climb one small profit at a time.
Lower win-rate systems are harder to live with from the beginning. Profits arrive less often. Losing stretches test your patience. But one large winner can recover several losses.
This is where automation helps me a lot. After a string of losses, I don’t have to talk myself into taking the next signal.
What about you? Do you prefer frequent small wins or fewer, larger winners?
Not every strategy in my portfolio gets an equal vote.
I run a systematic book: multiple strategies sharing the same capital, with weights chosen to fit the account.
But I build the foundation around deliberately simple systems.
I think of these as my “smart beta” sleeves.
The idea is to participate in market moves. Not constantly try to predict the next turn.
The risk management objective is to limit the damage from the worst market events. Not to beat the benchmark on every metric.
Two sleeves I currently use for this:
• Rotational momentum across stocks.
• CORE: trend following across a set of ETFs.
CORE is long-only, with very low turnover, but plays an important role in the overall portfolio.
I don’t need every strategy to be a highly active trading system. Some provide the foundation. Others complement it.
I want the weights to reflect those different roles.

50 live trades in my first SPX 0DTE option selling algo.
Roughly breakeven. Still in the "getting to know each other" phase.
A short romance or a long-term relationship? Too early to tell.
So far, the live path is consistent with the backtest. Roughly flat overall.
At this stage, that may be a useful outcome. A big drawdown could be demotivating. A big run could create too much confidence.
My main objective right now is to collect live execution data, compare actual fills with the ongoing backtest, and refine the machinery.
What I’m running:
• Selling 0DTE SPX call verticals.
• Risk capped by the vertical itself, with additional algo management to close some trades earlier.
• Small size while I battle-test the model.
Execution runs through my in-house Python scripts via IBKR.
This is my first execution bot built entirely through an LLM workflow, with me overseeing the process.
The execution is encouraging part: so far, I’m getting the midpoint fills I modeled in the backtest.
The model is simple, possibly too simple. I’m not treating 50 trades as proof of an edge.
But they are already giving me useful information about fills and ideas for further research. More importantly, they’re giving me the confidence to keep using LLMs to build execution systems I wouldn’t have been able to create on my own.

A mean reversion entry does not have to mean a quick exit.
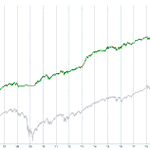
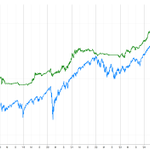
Here is an exit comparison for the QQQ long mean reversion strategy I trade live.
Blue: a typical fast exit - close the position when the closing price is above the 5-period moving average: C > MA(C, 5).
Green: the same entries, but a more trend-based exit aimed at capturing larger moves rather than taking profits quickly.
A small change in the exit rules. Quite a different profit path.
When trading long mean reversion on indices, what kind of exits do you prefer? Quick exits or giving the trade more room to run?

Same breakout signal. Different 0DTE strike. Quite a different payoff profile.
I currently trade my directional breakout strategy using slightly in-the-money 0DTE options.
In the backtest, switching to slightly out-of-the-money options drops the win rate from 43% to 37%, but produces substantially larger average winners.
Backtests use mid-price fills and a $500 risk budget per trade.
Cheaper OTM options fit that smaller budget better, which may explain part of the difference.
Definitely worth digging deeper.

Trading a system requires confidence in what you trade.
And confidence does not come from a nice backtest alone. It comes from research, practice, and experiencing the strategy with real money at risk.
This intraday breakout is a good example.
The equity curve looks nice. I’ve been trading the strategy live for roughly 2.5 years.
But individual days can still be frustrating.
The last few sessions were exactly like that: the market starts running, triggers the breakout, then reverses and turns the trade into a loss.
A smooth long-term equity curve does not mean a smooth trading experience.
And you need confidence in the system to keep following the rules through those frustrating sessions.

My intraday volatility breakout strategy just made a new equity high.
September was one of its strongest months in a long time. Exactly while several of my momentum and mean-reversion systems were struggling.
That is the diversification I want: not simply more strategies, but strategies that can make money in different market environments.
The combined long/short backtest shown in the chart:
$ 20 000 starting account
$ 30 722 net profit
−10.89% maximum drawdown
1.52 Sharpe
847 trades
Position size is based on a fixed risk of $200 per trade, with no reinvestment (fees included).
Intraday breakouts do have a weakness. When volatility disappears trading costs can become expensive. I therefore prefer to trade them only when historical testing suggests a higher probability of a directional session.
How would I start researching them?
1. Calculate the daily ATR.
2. Wait for today’s open.
3. Set breakout levels at:
Open + n * ATR
Open − n * ATR
4. Trade the first level that breaks.
5. Exit on a small stop or at the end of the day.
The basic model has only two important parameters: the ATR lookback and n, which controls the breakout distance.
These parameters should mainly change how frequently the strategy trades. I would not want to see one "magic" combination working while other values fail.
I published the rules and tests for the basic model here:
crackingmarkets.com/day-trad…
Free registration is required because I do not want the entire research archive scraped automatically by AI bots.

A strategy can underperform the index and still earn a place in my portfolio.
I care about what it contributes, how much capital it needs, and when it loses money.
When I share trading models, I often hear:
“Too much drawdown. Low Sharpe. Lower CAGR than buy and hold. Why bother?”
There are several reasons.

4. Public models are starting points for research.
When I share a model, I usually show the core principle.
There is still work to do.
Expecting every idea shared on social media to arrive with a Sharpe of 2 and be ready to be traded sets the wrong expectation.
The attached screenshot is a practical example of how I think about this.
It is my separate, smaller live IBKR account tracking one strategy: buying 0DTE calls and puts on intraday volatility breakouts.
May 17, 2024 (start of the account) - September 28, 2026:
94.10 % cumulative return.
21.35 % maximum drawdown.
It has beaten the index by a wide margin over that period, with higher volatility.
Would I use it as the only strategy in my larger account, where I also manage investor capital? No.
But I value its low correlation with the index and how it fits alongside my other strategies. It is one way I execute long/short intraday breakout within a broader portfolio.
Buying and holding an index is a valid choice. But if you want to be successful trader, judging every strategy by whether its standalone CAGR beats the index can send you into an endless search for the holy grail.
For me, the useful comparison is the portfolio with the strategy versus the portfolio without it.