

Teif lab at @uni_of_essex. We work on nucleosomes, chromatin, TFbinding, CTCF, cfDNA. Find us at 🐘 and 🦋. [email protected]; [email protected]
- Tweets1.7K
- Following1.7K
- Followers2.9K
- Likes5K





ALT Figure 1. (A) Classical gel electrophoresis experiments showing mono-, di-, tri-, tetra-, and further multinucleosome bands upon chromatin digestion. (B) The nucleosome repeat length (NRL) is defined as the genomic distance between the centres of two neighbouring nucleosomes.

ALT Figure 2. Nucleosome mapping using MNase-seq versus ATAC-seq. (A) In MNase-seq, nucleosomes in both open and tightly packed genomic regions are accessible to digestion. MNase preferentially cleaves DNA between nucleosomes and digests DNA until it encounters a histone octamer, which provides a footprint of nucleosome-protected DNA regions. (B) Bulk MNase-seq results in averaged maps across millions of cells, effectively capturing all possible nucleosome positioning configurations. (C) Single-cell MNase-seq (scMNase-seq) results in a noisier and sparser signal. The resulting footprints still represent nucleosome-protected regions, but not all nucleosomes are represented. (D) In ATAC-seq, open regions can be accessed by the enzyme Tn5 transposase, which can insert primers in regions free from the binding of nucleosomes and transcription factors (TFs). (E) For open chromatin regions, nucleosome maps can be obtained from ATAC-seq similar to MNase-seq. (F) Closed, tightly packed chromatin...

ALT Figure 5. Molecular mechanisms affecting nucleosome spacing. (A) Linker histones H1 and nonhistone chromatin proteins which compete with H1s and modulate nucleosome spacing through structural and electrostatic mechanisms. (B) Chromatin remodellers actively reposition nucleosomes following context-dependent rules. (C) Cell state-dependent chromatin boundaries formed by CTCF and other structural proteins, as well as associated recruitment of chromatin remodellers which space nucleosomes. (D) Gene activity associated with remodeller action and RNA polymerases transcribing through the nucleosomes, leading to smaller distances between nucleosomes in regulatory regions and gene bodies. (E) DNA sequence repeats of different types.

ALT Figure 6. Examples of NRL changes in biological systems. (A) Cell differentiation leads to NRL changes between different cell types, e.g. mouse dorsal root ganglia neurons (NRL ∼165 bp) versus cortical astrocytes (NRL ∼183 bp) [175]. Schematic cell shapes are adapted from an image created in BioRender (https://BioRender.com/89trj2t). (B) Paired normal versus tumour breast tissues show NRL shortening in cancer (figure adapted from [36] under the CC BY 4.0 licence (https://creativecommons.org/licenses/by/4.0/)). (C) Nucleosome positioning derived from cfDNA of human volunteers shows NRL increase with age (figure reprinted from [79] under the CC BY 4.0 licence (https://creativecommons.org/licenses/by/4.0/)).


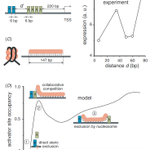
ALT Figure 1. (A) Experimental setup investigated (Fakhouri et al 2010). The enhancer element contains two binding sites for repressor ‘R’ and four for activator ‘A1–A4’. The distance d is varied. (B) Gene expression as a function of d plotted as 1 – P, with P being the repressor quenching efficiency reported by Arnosti and co-workers (Fakhouri et al 2010). (C) A lattice model of the nucleosome that allows DNA unwrapping with 1 bp resolution (Teif et al 2010). (D) Activator binding to the leftmost ‘A’ site calculated as a function of distance d assuming that the contact of nucleosome ‘N’ with repressor is cooperative (w = 1000). Repressor and activator cover 6 bp upon binding to DNA and exclude each other at distances < 6 bp. Nucleosomes form nonspecifically, cover up to 147 bp and can partially unwrap with a homogeneous unwrapping potential


ALT Figure 5 from Jacob et al, 2024. NRL shortening as a novel breast cancer marker. A–E) NRL values calculated for each individual sample from this study inside different types of genomic regions. A) Transcriptionally active A-compartments of chromatin annotated in breast cancer MCF-7 cells; B) Regions surrounding gene promoters. C Genomic regions around Alu repeats; D) Regions enriched with H1X linker histones in breast cancer T47D cells; E) Differentially methylated DNA regions annotated based on cell lines MCF-10A, MCF-7 and MDA-MB-231. Open squares—average NRL values for a given condition; horizontal lines—median values. The colours of the points are assigned per sample as in Fig. 3A. F) A scheme of the change of nucleosome compaction in breast cancer tissues. DNA (black) is wrapped around histone octamers (grey) in contact with linker histones (blue). MNase used in this study or apoptotic nucleases present in situ (orange) cut DNA not protected by nucleosomes and linker histones.


ALT Dr Vladimir Teif and his team at the University of Essex


ALT Early cancer diagnosis reaches highest ever level. A woman is receiving a breast screening from a healthcare worker.