



Check out this new article in Nightingale on Alexander von Humboldt's influence on infographics and data viz as written by TerraComm's own Ryan Huang: link.medium.com/3WKkLuiNZ0 #dataviz #sciencecomm #history

Always cool to see new (and very old) was of thinking and representing data! kottke.org/19/04/physical-da…

1
Sometimes it's fun to add a little icon magic to a webpage! #communication #scicomm

Another great article promoting the importance of data visualization: forbes.com/sites/evamurray/2…
1
A fantastic example of how great data visualization can make the answer so obvious!
#datavisualization #greatmaps #linguistics
Tea if by sea, cha if by land: Why the world only has two words for tea qz.com/1176962/ via @qz
It's always beneficial to get inspiration from the best! Check out some of the best data visualizations from the past year! theverge.com/2018/10/28/1802… via @Verge
Photos can help connect audiences to your research and experimental! Check out this BBC article that uses our photos for new research on color perception in songbirds: bbc.co.uk/news/science-envir…

"Excellent science communication can capture the imagination: sparking meaningful debate and discussion that grants science a stronger presence in our society." #scicomm #communication #science
blogs.nature.com/naturejobs/…
"To walk in nature is to witness a thousand miracles." ~ Mary Davis. So true! Plus, never forget the power of a great #naturememe! #nature #scicomm

1

It's time for your annual meeting, and you are looking for a new way to trumpet accomplishments. What about postcards? We designed this unique visual for the @CBA_NWFSC annual celebration. #scicomm #communication #nature

Looking for a way to describe your science project to a larger audience? A team of researchers and organizations in #California introduced #carbonfarming to their stakeholders using a blog + infographic combination designed by the team at TerraComm. carbonthroughcompost.wordpre…
You don't need expensive software to create interesting visuals. Here's a guide on using #Excel to make interactive waffle charts: policyviz.com/2018/04/26/int… #sciencevisualization #coolgraphs

"Good #communication is the bridge between confusion and clarity" - Nat Turner. #scicomm #terracomm #environment

Check out these crazy visuals depicting the invisible magnetic forces around our planet #sciencevisuals #NASA motherboard.vice.com/en_us/a…
2
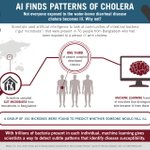
New #research on using #artificalintelligence to determine #disease susceptibility using gut microbiota! #sciencecommunication #scienceinfographics

TerraComm strikes again! Congrats to @TammyEDavies & her team for their new paper in #Nature Scientific Reports on marine species protection teapaw.org/TammyEDavies/status/90…

New OA paper: Large marine protected areas represent #biodiversity now & under #climatechange rdcu.be/vnsp
