

Tracking the end of the biggest cycle in modern history. CIF: 83/90 — Danger Zone | Weekly briefing ↓ | NFA · DYOR
Joined December 2025
- Tweets2.2K
- Following149
- Followers2.1K
- Likes4K




Pinned Tweet
DOTCOM FRACTAL UPDATE | August 4, 2026
─────────────────
A little over a year ago, looking at the S&P on a large timeframe, the structural similarities between the final phase of the Dotcom cycle and the current cycle became visible.
From there, tracking began in earnest, published regularly here. This spring, revisiting the substructure comparison between the Dotcom cycle and today showed two things.
First, the wave count had progressed further than initially assumed, a byproduct of only having tracked the weekly timeframe.
Second, and more importantly, the current cycle is mapping the S&P Dotcom fractal essentially one to one.
The Nasdaq is running the same fractal the S&P ran back then, and the Russell is tracking its own Dotcom fractal in parallel.
The same S&P Dotcom fractal also appeared during the financial crisis cycle.
What separates this cycle from both of those is structural. Back then, the S&P moved through overlapping, corrective structures rather than, impulsive ones, with only a small parabolic phase at the very end.
The Nasdaq, in the same window, ran its own distinct pattern, a full parabola between October 1999 and March 2000.
Today, both the S&P and the Nasdaq are running that Nasdaq-style parabola simultaneously, something neither the Dotcom nor the financial crisis cycle produced.
Both indices have been building that parabolic structure since the late March low, which represents the final leg of the entire cycle.
─────────────────
NASDAQ 100
As flagged last week, the correction from the June 3 high has run deeper and sharper than what the S&P and Russell have shown.
The June 9 low held between the 0.236 and 0.382 retracement, a threshold that marks the boundary most parabolas respect before reversing. Given how much momentum was concentrated in AI and how extreme the underlying leveraged product infrastructure has become over the past three years, this correction extended further, into the 0.5 zone, exactly as flagged last week as a possibility.
Wednesday July 29 saw a move down to roughly 27,200, briefly touching the November support area. One day later the index reversed sharply and closed back above the 0.382, and the week itself closed there too, a meaningful signal.
Yesterday, August 3, added another 1.8%. Since the July 29 low the Nasdaq is up roughly 5.8%, in a V-shaped recovery that closely echoes the reversal seen at the March 30, 2026 low.
That March structure has been overlaid in purple on the chart as a reference, the same overlay used on the S&P, to see whether the current move steepens the same way the April to June advance did.
The Nasdaq still has ground to cover, roughly 6.9% from current levels to its all-time high.
As written yesterday, there remain solid reasons for the Nasdaq to participate fully in the next leg, and the parabola is holding its structure. A deeper dip back toward the 0.5, around 26,800, cannot be ruled out. But the character of this move suggests we are drifting toward a breakout, not away from one.
─────────────────
S&P 500
The picture is cleaner here. The July 29 low, following the June 9 low that held the 0.382, printed a higher low, and the index has since rallied more than 4% at the peak. Currently sitting roughly 0.3% from all-time highs, the S&P has already broken the trendline that had held since June 3, and futures have briefly touched a new high pre-market, though not yet confirmed a breakout close.
The correction here has been notably shallower than the Nasdaq's, roughly 5% at the deepest point versus nearly 12% on the Nasdaq.
The March-to-June move has also been overlaid here in purple as a structural reference, purely to gauge whether the strength and extension repeat, not to claim any precise timing.
─────────────────
RUSSELL 2000
The Russell has been in a mild downtrend since July 1, breaking support near 2,930 on July 29 before immediately reclaiming it the next day, followed by a retest on Friday. Since then it has rallied as much as 3.7% at the peak, alongside yesterday's broader move. Targets remain unchanged.
─────────────────
TIMING
This is my own read on the structure, not a hard rule.
Roughly speaking, the topping window sits somewhere in late summer to early autumn across all three indices. Once a breakout is confirmed, the emerging substructure will tell us more precisely where we actually stand.
─────────────────
Structure
The March-to-June advance does not need to repeat identically. It can compress, as the KOSPI demonstrated.
It can also extend further than expected if genuine euphoria enters the picture. Anyone trying to pin down a maximum target in order to exit at the exact top runs into the same problem every cycle: that level often only gets touched briefly, because too many people are waiting for exactly that point to take profit. This is the phase where caution and clean risk management matter more than chasing a precise number.
There is a real case for extension here specifically because we have not seen classical euphoria yet, not in sentiment surveys, not amplified by media coverage.
What we have seen instead is the quiet, structural version of FOMO. If the narrative shifts during this next leg, if earnings, seasonality, midterms, and a year-end rally become the new justification for higher targets, many participants will read the next correction after this leg as just another normal pullback within a normal rally, not as the actual top. That is precisely the setup that tends to extend a move further than the structure alone would suggest.
Whoever is chasing the last piece of this move will find plenty of participants doing the same.
─────────────────
WHAT THIS MEANS
AI will almost certainly continue participating in the next leg, but the bulk of its momentum has likely already been spent.
For most participants, the eventual top will not feel like a top. The dominant narrative on the way there will most likely shift toward this being the continuation of a normal rally, followed by a normal correction, with a strong seasonal, midterm-driven year-end rally expected afterward.
The Dotcom fractal structure across the S&P and Russell does not support that read once this leg completes.
Once the structure breaks for the first time at the top, it will mark the first significant correction since April 2025.
If classical euphoria has entered the picture by then, that break will look to most like a dip to buy, a chance to ride the next wave up. In reality the parabola will most likely already be broken, and the next move will not do what the crowd expects.
We are not there yet.
The next step is watching for the breakout, its confirmation, and how the initial substructure forms.
This is a genuinely interesting window, crypto included.
The probability that Bitcoin has already found its bottom is high, and the probability that Bitcoin participates in this move alongside a breakout in the indices is, in my view, very high.
CIF: 83/90 — Warning Level Orange.
@TheBigCycleGame
Not financial advice. DYOR.
#DotcomFractal #SP500 #Nasdaq #Russell2000 #CIF #EndCycle #TheBigCycleGame


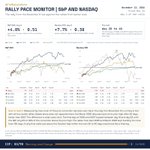
RALLY PACE MONITOR | November 13, 2026
─────────────────
The Rebound Test asks whether the November 6 low was a real low or a dead cat bounce. The Rally Pace Monitor starts one step later.
It assumes the low is in and asks what kind of rally has begun. To answer that, it compares the current rally with four others: the two rallies of this cycle, from the lows of April 2025 and March 2026, and the two final rallies before the major tops, from August 2007 and early 2000.
─────────────────
To make rallies of very different size comparable, the monitor measures how much of the prior correction has been won back: 0 is the low, 1.0 is the prior high. On that scale the current rally is running in line with all four. After four days the S&P has recovered 0.51 of its correction, the Nasdaq 0.38. Earlier rallies stood between 0.40 and 0.55 at the same point, with only the Nasdaq in 2000 moving clearly faster.
─────────────────
Speed alone does not separate them. The rally from March 2026 was back at its prior high after 20 days, faster than 2007, and still kept building for more than 130 days. The difference lies in where a rally ends. The final legs of 2000 and 2007 topped between day 19 and day 53, with the S&P only slightly above its prior high. The rallies of this cycle went much further.
That makes the next 20 to 40 trading days the real test. A rally that stalls just above the October high would look like a final leg. One that keeps building well beyond it would look like the rallies of 2025 and 2026. I will update the monitor as the rally develops.
CIF: 83/90 — Warning Level Orange.
@TheBigCycleGame
Not financial advice. DYOR.
#RallyPaceMonitor #SP500 #Nasdaq #MarketCycles #Dotcom #CIF #TheBigCycleGame

BITCOIN FRACTAL UPDATE - IGV | November 13, 2026
─────────────────
I looked at the Bitcoin fractal against the IGV again, as I did most recently in September, and I think it is worth another look, not least as a counterpart to the silver fractal of 2011 and the years before, in which silver came back hard after a strong parabolic rally, made a bear market rally and then set further lows.
The IGV fractal is interesting because it has held for years and shares a lot with Bitcoin. In the expansion phase Bitcoin and the software index were very close in time, at the top and at the bottom they were either level or only a few weeks apart.
─────────────────
The difference is in the current structure.
The IGV found its low in April and has since run up in a strong three part rally, while Bitcoin found its low almost three months later and now seems to mimic the structure.
The first move did not run as high as in software. In the IGV analogy it went from the low to the 0.786 of the whole move, while Bitcoin only entered the 0.5 area, at 87,000. Since then it fell to about 67,800. I read this move as a B wave, and it came to about 23% down, while the B move in the IGV analogy was just around 22%, so the two are similar. The day is not over, and the correction may not be either, so that number could still grow or stay the same.
─────────────────
Bitcoin can of course go lower and test the support area, and the fractal does not have to work out, it can break at any time. But it has held for several years and seems to play out so far, although the time lag has grown and the IGV now leads by two to three months.
That could be a good hint that the correction in Bitcoin and in crypto is moving toward its end and that the next move into the finale is being set up.
CIF: 83/90 — Warning Level Orange.
@TheBigCycleGame
Not financial advice. DYOR.
#Bitcoin #IGV #CryptoFractal #Fractal #CIF #EndCycle #TheBigCycleGame


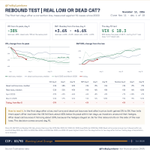
REBOUND TEST | DAY 5 OF 10 | November 13, 2026
─────────────────
Halfway through. The VIX rose back to 18.69 after Wednesday's big drop, now 34% below its November 5 peak and just above the day-10 test level of 18.3. That is still in line with past real lows, which had the VIX about 31% below its peak at this point, and well ahead of dead cat bounces at about 18%.
─────────────────
The S&P is 3.2% above its low, the Nasdaq 6.2%. Price still does not separate the two groups: at day 5, dead cat bounces were even stronger in the Nasdaq than real lows. Fear does. The decision comes on November 19.
CIF: 83/90 — Warning Level Orange.
@TheBigCycleGame
Not financial advice. DYOR.
#ReboundTest #VIX #SP500 #Nasdaq #MarketBottom #CIF #TheBigCycleGame


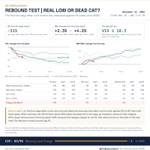
REBOUND TEST | DAY 4 OF 10 | November 12, 2026
─────────────────
A big step on day 4. The VIX closed at 17.48, now 38% below its November 5 peak and already under the day-10 test level of 18.3. At this point, real lows had the VIX about 28% below its peak, dead cat bounces about 15%.
─────────────────
Price is catching up. The Nasdaq is 6.6% above its low, ahead of the median of past real lows. The S&P is up 3.6%. The test is formally passed only if the VIX holds below 18.3 through day 10, on November 19. So far this rebound looks like a real low, not a dead cat bounce.
CIF: 83/90 — Warning Level Orange.
@TheBigCycleGame
Not financial advice. DYOR.
#ReboundTest #VIX #SP500 #Nasdaq #MarketBottom #CIF #TheBigCycleGame

1
6
533
IGV AND BITCOIN | November 12, 2026
─────────────────
Ben's video leans fully back into the fourth quarter low story, arguing that markets in midterm years play out as they did in the past and that Bitcoin makes its low in Q4.
It could be a higher low, but his preference is a lower one.
To be fair, he also leaves open that a higher high after the correction would not be a good sign, which is true. My base assumption, given the macro picture, is that we get a phase and not a new cycle, but that is not my point here.
─────────────────
The video refers above all to 2018, in particular because of the new hiking cycle, in which Bitcoin behaves just as it did then.
The macro picture is completely different.
That rates rise today does not make it comparable with the hikes of back then, at least not beneath that headline. The economy was clearly stronger in 2018, and today we have a pure supply shock and not a demand driven one.
All of that goes unexamined, and the pattern is presented as universal because only the headlines are matched with past patterns.
─────────────────
When the silver chart is presented to show that it could be normal for Bitcoin to range and then have the chance to break lower, one can just as well present the IGV chart, which has shown a similarity to Bitcoin for years now, especially when zoomed out.
Anything can happen in crypto, and it can go lower. But I think the IGV chart shows nicely what could await Bitcoin.
At the moment Bitcoin follows the IGV chart well, at least as far as the end of the IGV's correction goes, and the fractal the IGV formed shows up in Bitcoin right now. It can break, and it can play out differently.
But there are macro points beneath the surface that are the exact opposite of 2018, even if the headlines are the same or similar, and current structures show a very different picture as well.
CIF: 83/90 — Warning Level Orange.
@TheBigCycleGame
Not financial advice. DYOR.
#Bitcoin #IGV #Fractal #CryptoFractal #CIF #EndCycle #TheBigCycleGame


Bitcoin Q4 Dump Came Just The Same
youtube.com/watch?v=QcJlPjcO…

BITCOIN: CAPITULATION BY TIME? | November 12, 2026
─────────────────
Many traders are waiting for one more flush lower before they call a low. The data suggests that Bitcoin has changed how it corrects.
In the 2015 to 2017 and 2018 to 2021 cycles, corrections were short and violent: a week or two on average, with six drops of more than 25% in each cycle.
In the 2022 to 2025 cycle, corrections took more than twice as long, and none went deeper than 22%. Capitulation shifted from depth to time.
─────────────────
Five times in the last three bull cycles, Bitcoin worked off a correction mostly through time: 46 to 61 days of slow, overlapping trading rather than a sharp drop. Each one ended in a rebound of more than 20%. They bottomed between 18% and 30% below the prior high.
The current correction is 50 days old and 14% deep, with the slowest, most overlapping decline of any of them. In time and shape it fits the group. In depth it is still shallower than all five. From the September high, their range equals roughly 61,000 to 72,000.
─────────────────
If this is the same kind of capitulation, the final low is likely close and may come only a little deeper, followed by a rebound of 22% or more.
If price keeps grinding lower well beyond 60 days and below 61,000, it no longer looks like any of them.
Five cases, so a pattern, not a law.
CIF: 83/90 — Warning Level Orange.
@TheBigCycleGame
Not financial advice. DYOR.
#Bitcoin #BTC #Capitulation #MarketStructure #CIF #TheBigCycleGame

NVIDIA FRACTAL UPDATE | November 12, 2026
─────────────────
After the latest headlines around Nvidia's CEO and last night's news, the stock dropped again after hours and now trades near 162. Since the high of early October 2026 it has lost about 32%. I have heard and read many times that people see this as an entry opportunity, in the spirit of buying when there is blood in the streets, which can be a strategy. Today I want to look at the fractal instead.
─────────────────
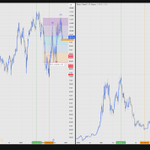
Interestingly, it shows a lot of similarity to Bitcoin. On the left of the attached image is Bitcoin from the end of 2022 to today, and on the right the Nvidia fractal from the end of 2023 to today.
The two structures overlap strongly, even if the volatility looks somewhat different in places. The correction we see in Nvidia has already gone very deep, and after last year's double top it has moved back into the correction phase of July 2025 to March 2026.
That is usually not a good sign for a stock that ran so hard and then enters the last large correction phase again, and it speaks more for further downside, as it did for Bitcoin in the correction from November 2025 to January 2026.
─────────────────
I copied Bitcoin's move and attached it to the current move. It makes no claim to timing or to lower prices, but it gives a good foretaste of what could happen to the Nvidia price if the fractal keeps playing out.
Given the semiconductor index, which very likely topped in the summer and follows the Dot-com fractal precisely, a bounce is certainly possible.
But as a long term investment, entering now to ride the next tech rally and speculate on a new all time high, the structure looks to me more like the opposite.
CIF: 83/90 — Warning Level Orange.
@TheBigCycleGame
Not financial advice. DYOR.
#Nvidia #NVDA #Fractal #Bitcoin #Semiconductors #CIF #EndCycle

REBOUND TEST | DAY 4 OF 10 | November 12, 2026
─────────────────
A big step on day 4. The VIX closed at 17.48, now 38% below its November 5 peak and already under the day-10 test level of 18.3. At this point, real lows had the VIX about 28% below its peak, dead cat bounces about 15%.
─────────────────
Price is catching up. The Nasdaq is 6.6% above its low, ahead of the median of past real lows. The S&P is up 3.6%. The test is formally passed only if the VIX holds below 18.3 through day 10, on November 19. So far this rebound looks like a real low, not a dead cat bounce.
CIF: 83/90 — Warning Level Orange.
@TheBigCycleGame
Not financial advice. DYOR.
#ReboundTest #VIX #SP500 #Nasdaq #MarketBottom #CIF #TheBigCycleGame
REBOUND TEST | DAY 3 OF 10 | November 11, 2026
─────────────────
Stocks took some profits after Monday's surge, but fear did not come back. The VIX closed at 19.45, now 31% below its November 5 peak. At this point, real lows had the VIX about 23% below its peak, dead cat bounces about 15%.
─────────────────
The S&P is 2.3% above the low, the Nasdaq 4.2%, both between the two groups, as expected: price alone does not tell them apart. The day-10 test is a VIX at 18.3 or lower.
CIF: 83/90 — Warning Level Orange.
@TheBigCycleGame
Not financial advice. DYOR.
#ReboundTest #VIX #SP500 #Nasdaq #MarketBottom #CIF #TheBigCycleGame

SAME CALENDAR, DIFFERENT ECONOMY | November 11, 2026
─────────────────
One of the most widely followed cycle readings uses the Bitcoin lows of 2018 and 2022 as the template for today: a low, a rally that fails, and a final low in the fourth quarter, driven by tight monetary policy.
As a chart pattern, that comparison can work. But once macro becomes part of the argument, all of macro belongs in it. So I put the numbers side by side.
─────────────────
Two points support that reading. Policy is restrictive in real terms: the Fed funds rate sits about one point above core inflation, tighter than in 2018 and far tighter than in 2022.
And credit is a real risk, one the template leaves out entirely. CCC spreads are higher than at any earlier Bitcoin low, and stress at the bottom of the credit ladder has been building since early 2025.
─────────────────
The rest of the picture does not repeat.
In 2018 and 2022 the Fed tightened into a strong economy, with 190,000 to 450,000 new jobs a month. Over the last twelve months it was 74,000, and less than 30,000 at the June low. Inflation then came from an economy running hot.
Today about a third of it comes from energy, while core inflation holds at 2.9%. That is a supply shock. And in 2018 and 2022 rates rose by one to three points in the year before the low. Today they are lower than a year ago.
─────────────────
That leaves one open question.
Oil has fallen 18% since mid September, and the inflation data does not show it yet. A first phase of relief is plausible: inflation fears fade and the Fed signals a pause. It would not even need credit to improve.
Spreads only need to hold where they are, because in an economy this weak the damage is already done.
CIF: 83/90 — Warning Level Orange.
@TheBigCycleGame
Not financial advice. DYOR.
#Bitcoin #Macro #FederalReserve #Inflation #CreditSpreads #CIF #TheBigCycleGame

7
506
DOTCOM FRACTAL UPDATE - S&P | November 11, 2026
─────────────────
Building on the Rebound Test, which looks only at the numbers, I now look at the smaller picture in the structure.
Since the low of Friday, November 6, near 7,323, the S&P has been rising for four days now, and premarket on the futures chart it has already tested 7,613. It is back in the Bull Market Support Band. Yesterday's daily candle first failed there, and this morning it is pushing back up into the band.
─────────────────
On the right, next to it, is the move from 2007, in the middle the 2007 low, and on the far right the move from the end of March this year.
The assumption is that the structure we are in, with the selloff, strongly recalls August 2007. The S&P just did not fall as deep, even though some market participants expect the correction to run further. There are differences in the fundamental structure beneath the surface, because many stocks and sectors had already corrected sharply while the S&P had not shown it, and it has now at least caught up with what the other sectors did earlier. I have written about that many times.
What matters now is the reaction at the Bull Market Support Band and above all whether it is won back. That can happen impulsively or take a few more days. The picture from April 2026 shows nicely that we are following the move from early April quite closely, which then pushed impulsively through the Bull Market Support Band.
The assumption is that the impulsiveness from that first phase, which was the first leg of the last parabola, can be kept for the second leg up as well.
CIF: 83/90 — Warning Level Orange.
@TheBigCycleGame
Not financial advice. DYOR.
#DotcomFractal #SP500 #BullMarketSupportBand #CIF #EndCycle #TheBigCycleGame

REBOUND TEST | DAY 3 OF 10 | November 11, 2026
─────────────────
Stocks took some profits after Monday's surge, but fear did not come back. The VIX closed at 19.45, now 31% below its November 5 peak. At this point, real lows had the VIX about 23% below its peak, dead cat bounces about 15%.
─────────────────
The S&P is 2.3% above the low, the Nasdaq 4.2%, both between the two groups, as expected: price alone does not tell them apart. The day-10 test is a VIX at 18.3 or lower.
CIF: 83/90 — Warning Level Orange.
@TheBigCycleGame
Not financial advice. DYOR.
#ReboundTest #VIX #SP500 #Nasdaq #MarketBottom #CIF #TheBigCycleGame
REBOUND TEST | DAY 2 OF 10 | November 10, 2026
─────────────────
After every sharp drop, the same question comes up: is this a real low or just a dead cat bounce?
Starting today, I will track the first ten trading days after the November 5 low and answer it with data, not opinion.
The card compares the current rebound with 14 cases since 2000: seven real lows, including April 2025 and March 2026, and seven rebounds that ended in a lower low, such as 2000, 2008 and twice in 2022.
─────────────────
The idea behind it is simple. If real lows and dead cat bounces behave differently early on, the first days should show it. Looking back to 2000, price does not tell them apart. In the first days, both kinds of rebound gained 2% to 5%, and in the Nasdaq the dead cat bounces were often even sharper.
Fear does. After real lows, the VIX fell fast, about 45% below its peak within ten trading days, as investors unwound their hedges. After dead cat bounces it fell only about 20%, because the hedges stayed on. By day 10, five of seven real lows had the VIX at least 35% below its peak. Only one of seven dead cat bounces got there.
─────────────────
What we see now, based on Monday's close: the VIX closed at 19.93, 29% below its peak of 28.17 on November 5. That is more than the median of the real lows at this point, and almost three times the median of the dead cat bounces. The S&P is up 2.7% from the low, the Nasdaq 4.8%, both in line with past real lows.
So far this rebound sits on the side of the real lows. The test comes around day 10: a VIX at 18.3 or lower would confirm it. Daily updates follow until November 20.
CIF: 83/90 — Warning Level Orange.
@TheBigCycleGame
Not financial advice. DYOR.
#ReboundTest #VIX #SP500 #Nasdaq #MarketBottom #CIF #TheBigCycleGame

The Retail Monitor in two numbers.
Crypto search score: 1 out of 100, at the floor for a third week. Robinhood app crypto volume: down 48% from a year ago. Equities tell the opposite story: margin balances up 59%. Retail has not left the market. It has left crypto.
@TheBigCycleGame
Not financial advice. DYOR.

RETAIL MONITOR | November 9, 2026
─────────────────
Last week stocks sold off, the VIX closed above 25 and Bitcoin slipped toward 76,000. Crypto searches did not move. The crypto search score held at 1 out of 100 for a third week in a row, with Bitcoin searches only 16% and Coinbase searches 17% above their five-year lows. Falling prices brought neither panic nor bargain hunters.
The equity score rose to 32 from 28, helped by more searches for buying stocks and for stocks to buy, while options trading stayed in the upper range. That looks like existing investors hunting for a dip, not newcomers arriving.
─────────────────
New this week: altcoins now have their own section on the card. Searches for altcoins sit near their five-year lows, just like Bitcoin. Memecoin searches are the exception, still unusually high, a small pocket of speculation in an otherwise empty crypto crowd.
Which raises the obvious question. If retail is not in crypto, where is it?
Later today I will publish a new Equity Retail Monitor that follows the money and the attention into leveraged ETFs, AI stocks, prediction markets and gold.
CIF: 83/90 — Warning Level Orange.
@TheBigCycleGame
Not financial advice. DYOR.
#RetailMonitor #Bitcoin #Altcoins #Retail #CIF #TheBigCycleGame


It's worth listening to the part with @alessiorastani 👇🏻
Investing Through the Cycles Conference (A Preview): Live with the Speakers teapaw.org/i/broadcasts/2dKRakOZL…

2
380
THE COVER STORY | November 10, 2026
─────────────────
Inflation came in hotter than expected today, although that was no surprise given where oil stood last month and what the prices component of the ISM already showed.
Now everyone is fearful and looks at a rate hike in December, and social media calls it bad for risk assets and no environment in which they can unfold.
Could it be that the market is mainly using todays fear to take profits from the last two days, before the move continues?
CIF: 83/90 — Warning Level Orange.
@TheBigCycleGame
Not financial advice. DYOR.
#CPI #Inflation #SmartMoney #Markets #CIF #EndCycle


ALTCOINS: THE FAKE-OUT TEST | November 10, 2026
─────────────────
Two weeks before I compared the 2026 altcoin rally with three fake-outs, April 2018, August 2018 and June 2022, and with the rallies that followed a higher low in 2020 and 2023.
The key difference was where it started: every fake-out began in a bear market, before the cycle low. The 2026 rally came after the February low and a higher low in August, the same order as 2020 and 2023.
Ten days later the aftermath still sits in between. Forty-four days after the peak, OTHERS is 23% lower. The fake-outs were 30% to 52% lower at the same point, while the rallies after a higher low were up 3% to 18%. Altcoins remain below their 100-week average.
─────────────────
This update adds the bull market support band, built from the 20-week and 21-week averages. OTHERS reclaimed it on August 31 and is now testing it, around 200 to 206 billion, with the band still rising.
History adds a useful nuance. In 2015 the band was lost in September and the bear market went on. In 2023 it was lost too, in May, but what followed was a higher low in June and a new reclaim in July that started the next leg. Losing the band is not a verdict on its own. What comes after decides: a lower low as in 2015, or a higher low as in 2023.
─────────────────
That makes the August higher low near 157 billion the line that matters. As long as it holds, a break of the band would look more like 2023 than 2015. Below it, the reading turns toward a fake-out.
CIF: 83/90 — Warning Level Orange.
@TheBigCycleGame
Not financial advice. DYOR.
#Altcoins #OTHERS #CryptoCycles #BullMarketSupportBand #CIF #TheBigCycleGame

ALTCOINS: THE FAKE-OUT TEST | October 31, 2026
─────────────────
The same question for altcoins, measured on OTHERS, the crypto market outside the top ten. The chart compares three fake-outs, April 2018, August 2018 and June 2022, with the rallies that followed a higher low in 2020 and 2023, and with today.
Every fake-out started in a bear market, before the cycle low. The 2026 rally did not. It came after the February cycle low and a higher low on August 11, the same order as 2020 and 2023, with almost the same distance between low and higher low as in 2023. It also climbed more directly than 2020, 2023 and the 2022 fake-out.
─────────────────
What does not fit yet is the aftermath. After 2020 and 2023, altcoins kept building higher. In 2026 they gave back 18% within five weeks and slipped below the 100-week average. Fake-outs lost 26% to 35% over the same span. Today sits in between.
The level that decides is the August higher low near 157 billion. As long as it holds, the structure points to a correction within a new cycle, not a fake-out.
CIF: 83/90 — Warning Level Orange.
@TheBigCycleGame
Not financial advice. DYOR.
#Altcoins #OTHERS #CryptoCycles #MarketStructure #CIF #TheBigCycleGame

ETHEREUM FRACTAL UPDATE | November 10, 2026
─────────────────
Building on the post of November 5, Ethereum tried to win back the resistance zone, but it went lower again, which turned out to be a fake out.
In the days after, above all on Sunday, November 8, it left the Bull Market Support Band to the downside on the daily chart. It now trades inside the tolerance zone, which is being tested.
─────────────────
We saw something similar in June 2025, though not with the same strength. Back then the price also dipped, left the support band briefly and won it back with the close of the following day. We do not have that in the same form today.
It looks as if Ethereum may test the next Fibonacci area, the 0.887 near 1,961, and a counter move back into the support band, and possibly a recapture, should follow at the latest from there.
Given where the overall market and sentiment stand, I do not see the move as critical, and I still assume that the next impulse up comes as soon as the correction is complete.
CIF: 83/90 — Warning Level Orange.
@TheBigCycleGame
Not financial advice. DYOR.
#Ethereum #CryptoFractal #Altcoins #BullMarketSupportBand #CIF #EndCycle #TheBigCycleGame

ETHEREUM FRACTAL UPDATE | November 5, 2026
Yesterday Ethereum won back the resistance area with a daily candle of almost 8% at the high.
That suggests the area is now tested as support first. In 2025 it took 15 days until the next breakout followed, and in 2021 18 days.
─────────────────
The two fractals differ in one respect. The 2025 one was impulsive both before and after the correction, while the 2021 one was overlapping and corrective on both sides.
Regardless, the structure looks good right now. It is worth preparing for another phase of sideways activity from here, one that will demand patience in a sentiment that has no patience left to begin with. That is the key.
CIF: 83/90 — Warning Level Orange.
@TheBigCycleGame
Not financial advice. DYOR.
#Ethereum #CryptoFractal #Altcoins #Bitcoin #CIF #EndCycle #TheBigCycleGame

BITCOIN: THE FAKE-OUT TEST | November 10, 2026
─────────────────
On October 31 I compared Bitcoin's rebound with the fake-outs of 2015 and 2022, both of which ended in a new low. The test I named then was the 350-day average near 76,000. Ten days later, that test is under way.
Bitcoin closed below the 350-day average on November 8 and 9 and trades below it again today, even as stocks staged a strong rebound. Fifty days after the September peak, it sits 15% below it. In 2015 it was 27% lower at the same point, in 2022 19%. The gap to the fake-outs has narrowed, from about twelve points to four to twelve.
─────────────────
This update adds a second, weekly view: the bull market support band, built from the 20-week and 21-week averages. It shows how the 2015 fake-out actually unfolded. Bitcoin reclaimed the band in July 2015, lost it on a weekly close seven weeks later, and only then made its new low. In 2022 the band was never reclaimed at all.
2026 reclaimed the band on August 31 and has held it for ten weeks. Price is now testing it, between 74,300 and 76,300, inside a tolerance zone down to about 71,200. One difference matters: in 2015 the band was flat when it broke. Today it is still rising.
─────────────────
The 350-day average and the band now sit almost on top of each other, which makes 74,000 to 76,000 the zone that decides.
A move back above 75,600 would keep the 2026 path different from the fake-outs. A weekly close below the zone, near 71,200, would repeat the 2015 step. This Sunday's weekly close is the first real check.
CIF: 83/90 — Warning Level Orange.
@TheBigCycleGame
Not financial advice. DYOR.
#Bitcoin #BTC #MarketStructure #BullMarketSupportBand #CIF #TheBigCycleGame

BITCOIN: THE FAKE-OUT TEST | October 31, 2026
─────────────────
A popular reading says Bitcoin's rally was a fake-out, like the rebounds of summer 2015 and summer 2022, both of which ended in a new low. This chart lines up all three rebounds on their peak.
The differences start with the climb itself. In 2015 and 2022 the rebound topped out at or below the 350-day average, roughly the 50-week line.
In 2026 it peaked 11% above it. The 2026 climb was also steadier: half the daily swings of 2022, and not a single day down 5% or more. Speed is not the difference, though. Per day, it rose about as fast as 2022.
─────────────────
The bigger gap is what came after. Five weeks past the peak, Bitcoin was 26% lower in 2015 and 23% lower in 2022. In 2026 it was 11% lower. The test is now the 350-day average near 76,000. A sustained break would make 2026 look much more like the fake-outs. A new low in the old pattern would need a drop below the June low at 57,737.
CIF: 83/90 — Warning Level Orange.
@TheBigCycleGame
Not financial advice. DYOR.
#Bitcoin #BTC #MarketStructure #CryptoCycles #CIF #TheBigCycleGame

REBOUND TEST | DAY 2 OF 10 | November 10, 2026
─────────────────
After every sharp drop, the same question comes up: is this a real low or just a dead cat bounce?
Starting today, I will track the first ten trading days after the November 5 low and answer it with data, not opinion.
The card compares the current rebound with 14 cases since 2000: seven real lows, including April 2025 and March 2026, and seven rebounds that ended in a lower low, such as 2000, 2008 and twice in 2022.
─────────────────
The idea behind it is simple. If real lows and dead cat bounces behave differently early on, the first days should show it. Looking back to 2000, price does not tell them apart. In the first days, both kinds of rebound gained 2% to 5%, and in the Nasdaq the dead cat bounces were often even sharper.
Fear does. After real lows, the VIX fell fast, about 45% below its peak within ten trading days, as investors unwound their hedges. After dead cat bounces it fell only about 20%, because the hedges stayed on. By day 10, five of seven real lows had the VIX at least 35% below its peak. Only one of seven dead cat bounces got there.
─────────────────
What we see now, based on Monday's close: the VIX closed at 19.93, 29% below its peak of 28.17 on November 5. That is more than the median of the real lows at this point, and almost three times the median of the dead cat bounces. The S&P is up 2.7% from the low, the Nasdaq 4.8%, both in line with past real lows.
So far this rebound sits on the side of the real lows. The test comes around day 10: a VIX at 18.3 or lower would confirm it. Daily updates follow until November 20.
CIF: 83/90 — Warning Level Orange.
@TheBigCycleGame
Not financial advice. DYOR.
#ReboundTest #VIX #SP500 #Nasdaq #MarketBottom #CIF #TheBigCycleGame
WEEKLY UPDATE - SHORT VERSION | November 9, 2026
─────────────────
Last week the Nasdaq lost 5.5% to 26,989 and the S&P 500 3.07% to 7,376, while the VIX jumped almost 35% and CNN Fear & Greed fell to extreme fear at 22. The selloff hit tech and semiconductors hardest, with semis down 14.08%, while the equal weight index and the Russell held up better, which shows that the rotation is still under way and that the indices are catching up with what weak breadth had shown for weeks.
Both Nasdaq and S&P appear to follow the 2007 structure in their final act, and the chances are good that the correction is at or near its end, even though a move lower once more is possible. The Russell gave back its whole recovery, and the reading stays that a bounce toward 2,900 to 3,000 lies ahead before the correction continues.
In crypto, Bitcoin lost 3.11% to about 75,800 in its fifth week of decline and Ethereum 1.56%, while interest among newcomers stays at an extreme low. I read this as a bullish phase inside a bear market that has not ended, and unlike 2023, sentiment has not flipped bullish yet, which makes much deeper lows hard to imagine.
The midterms, a strong jobs report and the fall in oil of almost 12% on peace hopes set the tone, while yields fell for the fourth week in a row despite hike expectations and the credit signal turned to CONFIRMING, which is no relief.
The most important point of the new week is October CPI on Tuesday, together with the talks between Russia, Ukraine and the US in Abu Dhabi, followed by producer prices on Friday.
CIF: 83/90 — Warning Level Orange.
@TheBigCycleGame
Not financial advice. DYOR.
#WeeklyUpdate #CIF #Nasdaq #Bitcoin #Russell2000 #Credit #TheBigCycleGame

WEEKLY MACRO UPDATE | November 8, 2026
─────────────────
MARKETS
S&P 500
Close: 7,376 | Weekly: −3.07%
CNN Fear & Greed: 22 — Extreme Fear
Nasdaq 100
Close: 26,989 | Weekly: −5.50%
Russell 2000
Close: 2,754 | Weekly: −2.39%
Dow Jones
Close: 51,275 | Weekly: −1.17%
S&P 500 Equal Weight (SPXEW)
Close: 8,748 | Weekly: −1.06%
SPXEW/SPX: +2.00% | Russell/SPX: +0.43%
Another week of heavy selling in tech. The Nasdaq lost 5.5%, the S&P 500 3.07% and the VIX jumped almost 35%, with CNN Fear & Greed back in extreme fear.
The equal weight index and the Russell held up clearly better, with the equal weight index beating the cap weighted S&P by about 2%.
─────────────────
DOTCOM FRACTAL STATUS
There was a detailed update on Friday and the reading has not changed. The structures remain intact. With more structure added, especially in the Nasdaq, it looks as if the Nasdaq follows the 2007 structure in its final act, and the correction that began in the summer fits that structure on both the large and the small time frame.
The chances are good that the correction is either already behind us or close to its end, which many do not expect. If the recovery that began on Friday continues early in the week, analysts will probably answer reflexively that it is only a dead cat bounce, as they did in April 2025 and again in April this year, which led to many misjudgments. One should still not be surprised if it goes lower once more.
teapaw.org/thebigcyclegame/status…
The S&P also seems to follow the 2007 structure and has not gone as deep so far. The difference to 2007 is that the breadth only corrected then once the S&P began to sell off, while in this phase breadth started to correct much earlier without the index showing it. A large part of the correction has therefore already run hidden, and the index is now catching up.
teapaw.org/thebigcyclegame/status…
The Russell gave back the whole recovery it had started and formed a lower low on Friday.
The reading is unchanged. A bounce lies ahead, and the area between roughly 2,900 and 3,000 could be tested once more. A stronger move toward new all time highs is not ruled out, but technically much would have to happen first. For now the Russell has its top in, and after the bounce the correction should continue lower.
teapaw.org/thebigcyclegame/status…
─────────────────
SECTOR ROTATION
Weekly performance: XLC +4.40%, XLRE +1.93%, XLY +0.56%, XLF +0.37%, XLP +0.11%, XLV +0.08%, KRE −0.52%, XLU −0.48%, XLB −2.33%, XLI −3.72%, IGV −5.69%, XLK −8.69%, XLE −10.47%, SOX −14.08%
XLK vs XLU: −8.24% | XLY vs XLP: +0.30%
Only six of fourteen sectors finished higher, after nine. The sector that carried the rally for months is giving up the most, with semis down 14.08% and tech down 8.69%, and according to the Dot-com fractal the SOX topped in the summer and has been correcting ever since. Energy lost 10.47% as oil fell almost 12%. For the last leg up to come, breadth probably has to return, because the momentum is out of semiconductors. A hard comeback there is possible, but the reading of the SOX makes it difficult, and a comeback in breadth is more likely.
─────────────────
RATES, DOLLAR AND COMMODITIES
30-year: 5.263% | Weekly: −1.24%
10-year: 4.859% | Weekly: −1.84%
2-year: 4.512% | Weekly: −2.04%
DXY: 102.28 | Weekly: +0.30%
Oil (WTI): $90.35 | Weekly: −11.76%
Gold: 4,069 | Weekly: +4.84%
Silver: 51.90 | Weekly: +5.61%
VIX: 25.63 | Weekly: +34.54%
Yields fell for the fourth week in a row, the 2 year most. Oil dropped almost 12% on hopes for a peace deal after the midterms, while gold gained 4.84% and silver 5.61%, so among the commodities the precious metals are stronger than almost everything else this week.
─────────────────
CRYPTO
Bitcoin: 75,800 | Weekly: −3.11%
Bitcoin vs S&P 500: −0.20%
Crypto Fear & Greed (CoinMarketCap): 32 — Fear
Ethereum: 2,238 | Weekly: −1.56%
Bitcoin has fallen for five weeks in a row and has bounced twice off the 50 week moving average that many watch. A weekly close below it would mean the bear market is not over and new lows are coming.
At the same time the biggest names in the scene are speaking up again. They read the start of the correction in traditional markets as the beginning of the broad correction, as it often is around the midterms, expect crypto to be dragged down and see traditional markets finding their low only at the end of the year or early next year. Even so, crypto held up well against traditional markets, and Bitcoin against the S&P was almost unchanged on the week.
The core of the debate is the new cycle. One camp says the bottom is in and the new cycle has begun, the other says the bottom is not in yet and the new cycle starts afterwards. Why many indicators work less reliably than people are used to may simply come from the width of the cycle in traditional markets, in which crypto no longer experiences the cycle many expect.
My reading is that this is only a bullish phase inside a bear market that has not ended, in which Bitcoin makes another corrective rally, as in the second half of 2021 or in 2025, while the altcoins complete the structures they could not finish at the end of 2025.
That is why I look less at structures that build from scratch after a classic cycle bottom and more at those that follow a completed bull cycle, as after April 2021. A lot of the misunderstanding comes from thinking only in black and white.
─────────────────
RETAIL AND NARRATIVE MONITOR
Both monitors cover the week of October 25 to 31, so they do not yet reflect last week's selloff in equities or the further drop in Bitcoin. Interest among newcomers stays at the bottom. The crypto search score held at 1 for a second week, and with Bitcoin falling below 80,000 neither bargain hunters nor panic arrived. Bitcoin searches stand only 28% and Coinbase searches 20% above their five year lows, the equity score rose to 32 from 29, and Coinbase's third quarter shows monthly users at 7.4 million, 20% fewer than a year ago, with consumer spot volume down 59%.
teapaw.org/thebigcyclegame/status…
In the Narrative Monitor the bull share rose to 52% from 47%, above 50% for the first time since mid September, while searches for the four year cycle and for a bottom stay above 90% of all weeks since 2021. Most of that week's searches came before the drop below 80,000, so this week's data will show whether the crowd turned more cautious. A small, mostly unconvinced core and an absent public is still the picture, and the warning would come with a bull share above 60% and rising supercycle searches while retail stays away.
teapaw.org/thebigcyclegame/status…
─────────────────
CREDIT MONITOR
The broad junk bond market started to move. The high yield spread widened to 348 basis points, up 45 in a month and only 12 below the stressed trigger near 360, while BB bonds rose to 2.13% from a low of 1.50% in late August and CCC spreads held at 13.20%. The signal changed from DIVERGING to CONFIRMING, which is no relief, because with the S&P now 5.9% below its high, stocks have started to confirm what credit has signaled since late September.
teapaw.org/thebigcyclegame/status…
Stress concentration fell to 5.2, but only because BB is rising and not because CCC is falling, which is how stress began to spread in 2000 [Link]. A high yield spread above 360 basis points with BB holding above its recent range would turn the signal to STRESSED.
─────────────────
MIDTERMS
The midterms were one of the topics of the week. Democrats won the House by a wide margin and flipped the Senate, with seven Republican seats changing hands, and they did so in traditionally Republican states as well. In Texas, Democrats won both the Senate seat and the governorship, and voters cited high prices and the war in Iran. Stocks rallied on Wednesday, with the Dow having its best post-midterm day since 1982.
On Thursday the Nasdaq fell 5.5% as fears grew that a Democratic Congress and states like Texas could tighten rules or even pause the buildout of AI data centers. I would not over-interpret this. It is not a fundamental reason, the market is looking for an explanation, and the sell off of the heavyweights was visible in the structure beforehand.
─────────────────
MACRO AND EARNINGS REVIEW
On Friday the October jobs report beat expectations clearly, with 165,000 jobs, unemployment at 4.1% and September revised higher. Expectations for a December hike rose, but the 10 year yield fell about 1.8% on the week and closed Friday only slightly higher, by roughly 0.5%, which I would not overweight.
The reading fits, because yields would have reacted much more strongly if the market saw the jobs data as the core of the inflation problem, and Warsh has pointed out that the labor market is not the reason for inflation, so the reflex that strong data means a hike does not hit the core of it. As I laid out in my post on payrolls around the top, payrolls are no longer the best indicator of strength at the end of a cycle, and the level the market celebrates is low compared with earlier cycles.
teapaw.org/thebigcyclegame/status…
Earnings continued with Apple, Palantir, AMD, Super Micro, Arista and Qualcomm.
Apple earned 2.10 dollars per share on revenue of 114.5 billion, up 12%, and Palantir grew revenue 96% to 2.31 billion and raised its outlook, yet both fell after the reports before Apple reached a record high on Wednesday. AMD grew data center revenue 97% but free cash flow fell 64%, and the stock fell 17% on Thursday. Super Micro beat revenue by a wide margin and Arista rose 12% on guidance, while Qualcomm lost 9.5% on a weak outlook and Arm 13% despite 27% revenue growth. AppLovin jumped 31%. Expectations were mostly met or beaten, but the market now reacts to outlooks, margins and cash flow more than to the quarter just reported.
─────────────────
GEOPOLITICS
On Iran, markets are pricing in peace, with Brent down about 16% on the week, its biggest drop since 2020, as the midterm result raised hopes of de-escalation. Qatar submitted a 48 hour plan in which Iran would reopen the Strait of Hormuz and commit to nuclear talks. Neither side has formally accepted it, and Iran is reviewing it. Trump says the talks continue and a deal is still possible, yet the US struck an Iranian air defense system on Qeshm Island on Saturday for the second time in five days, and attacks on tankers continue. One energy analyst sees an 80% probability that fighting resumes.
In Russia and Ukraine, negotiators from both sides and the US meet on Tuesday in Abu Dhabi for a fourth round of talks. Ahead of it, Russia hit Kyiv and other regions with missiles and drones on Saturday, damaging networks that carry power from nuclear plants to Kyiv, while Ukraine struck industrial sites in Oryol. Zelensky says Moscow is stepping up the pressure before the talks.
─────────────────
THE WEEK AHEAD
October CPI follows on Tuesday, with consensus at 0.3% on the month after 0.6% in September, core at 0.2%, and a Cleveland Fed estimate of about 3.7% year over year.
Producer prices follow on Friday, expected at 0.3% to 0.4% after 1.3% in September. CPI is the last inflation report before the Fed's December 9 meeting.
It can come out hotter than expected, as the ISM prices component and energy prices suggested, but with yields lower the weight of the data should be a different one.
CoreWeave reports on Tuesday and Cisco on Thursday.
─────────────────
BOTTOM LINE
The picture is interesting. Until early summer we saw very strong advances in the indices and in single stocks, and since the summer a correction has been running that is still not over. At the same time the rotation was in full swing. The indices looked strong while many sectors bled and were already in bear market territory weeks ago, and now the indices are catching up with what the weak breadth had shown.
Tech gave up the most last week, while the equal weight index and the Russell held up comparatively well, and Bitcoin and Ethereum did too, despite the Binance hack more than a week ago and despite the selloff in tech. That shows the rotation is still under way.
Next to technical data, Fibonacci levels and support zones, the psychological side is often ignored. Many in traditional markets now call for a further correction, and big names have started to look at a fourth quarter bottom again, which is actually good for the market. In crypto the crowd will not be right. It looked at a fourth quarter bottom, watched the rally from the sidelines and now hopes it goes lower. The more big names say it will go much deeper because the indices are correcting, the more people take that narrative back up, and those on the sidelines will not start building positions now but wait, as so often, for the best possible entry, which is neither here nor at 72,000 but much lower.
Many compare today's structure with 2023, but psychologically there is a clear difference. The Retail Monitor and the Narrative Monitor both show interest at an extreme low. If this were the 2023 structure and the bottom were already in, it would meet a base that is far more uncertain than it was then, because at the same point in 2023 sentiment had already flipped clearly toward a bullish bias. The flip came quickly, the majority already assumed the bottom was in, and the structure held without forming a new low.
Today many compare the structure but expect another leg down, while the flip has not happened yet. On the psychological timeline we are still behind the 2023 structure, and since that structure held with a better psychological base, it is hard to imagine that with less interest and no flip yet, much lower lows should follow now.
Whichever narrative is used, whether the election, the better jobs data or inflation, all of them point lower, which is exactly the kind of setting in which markets tend to turn. The market expects another hike in December and with it more pressure on risk assets, yet Treasuries have fallen since the end of September, and they may well have seen their top. In this phase the market does not move as rationally as many would like. The index surface has already corrected far more than the indices show, and Nasdaq and S&P seem to follow the 2007 structure in their final act, whose base in the years before was the same Dot-com fractal from 1996 to 2000. History does not repeat but rhymes, so the end phases can still run somewhat differently.
The current reading therefore strongly allows that we are already at the end of the correction or close to it, in traditional markets and in crypto. Psychologically the sentiment is perfect for a further rise. The rally in crypto was driven more by uncertainty and worry than by conviction, so declines fall on a base that never assumed it could go higher, and the altcoins, which are still bleeding and have given back most of the August move, offer the base from which further gains can start.
I stay with the picture of all the sequences we see, which recall 2000 and a combination with 2007, with several indices already having followed their Dot-com patterns and now in correction mode. We are in the last phase, and crypto will probably not experience a complete new spring in it, but a last rally before the final bell.
CIF: 83/90 — Warning Level Orange.
@TheBigCycleGame
Not financial advice. DYOR.
#WeeklyMacroUpdate #CIF #Nasdaq #Bitcoin #Russell2000 #Credit
