

Decision-making insights, infographics, and reports for everyone! (A product of @Businessfront) 🌐https://xitter.cf/t.co/YRxnqCIXsz
Lagos, Nigeria
Joined May 2021
- Tweets4.3K
- Following6
- Followers5.2K
- Likes401



Pinned Tweet
📢 New Report: How to expand into Africa
Africa is a market of over 1.5 billion people, with accelerating digital adoption.
In partnership with @ItanaAfrica, we've put together a practical guide for expansion in Africa.
Get the guide now intelpoint.co/report/how-to-…

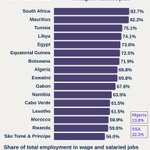
Only 13.8% of employed Nigerians held wage or salaried jobs in 2025.
The other 86.2% were self-employed. That group includes employers, people working for themselves and contributing family workers, who may work without direct pay.
Across Africa, wage and salaried workers formed a majority in only 16 of 51 countries with data. South Africa (82.7%) and Mauritius (82.2%) led. The list includes all five North African countries with data and the five members of the Southern African Customs Union. Cabo Verde (61.5%) was the only West African country on it.
Nigeria was also below the sub-Saharan African share of 22.3% and the global share of 53.6%.
A wage job doesn't automatically mean a pension or health cover. But the World Bank notes that people working for themselves or in a family business are the least likely to have formal work arrangements or social protection.
Which describes you: working for an employer, for yourself, or both?
Seychelles, South Sudan and Sudan had no 2025 values.

Intelpoint retweeted
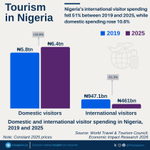
For every ₦100 international visitors spent in Nigeria in 2019, they spent about ₦49 in 2025, after adjusting for inflation.
The World Travel & Tourism Council (WTTC) estimates that international visitor spending fell 51.3%, from ₦947.1 billion to ₦461 billion over those six years. After recovering to about ₦73 per ₦100 of its 2019 level in 2022, it fell for three consecutive years, including an 18.6% drop in 2025.
Domestic visitor spending moved the other way, rising 10.6% between 2019 and 2025 to ₦6.39 trillion. That is about 1.7% growth a year, compounded. In 2025, domestic spending accounted for roughly ₦93 of every ₦100 spent on travel and tourism within Nigeria, across business and leisure trips.
All spending figures are WTTC estimates at constant 2025 prices. The per-₦100 comparisons and compounded annual growth rate were calculated by Intelpoint from WTTC data.
Source: World Travel & Tourism Council: Travel & Tourism Economic Impact Research 2026. All rights reserved.

Intelpoint retweeted
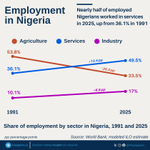
Agriculture accounted for more than half of employment in Nigeria in 1991. By 2025, its share had fallen to a third, according to modelled ILO estimates published by the World Bank.
Over the same period, services’ share rose from 36.1% to 49.5%, recording the largest increase among the three broad sectors. Industry’s share also increased, from 10.1% to 17.0%.
Across the 34 years, agriculture’s share fell by 20.31 percentage points, while services and industry gained 13.38 and 6.93 percentage points, respectively.
Note: Agriculture includes farming, hunting, forestry and fishing. Industry includes mining and quarrying, manufacturing, construction, and public utilities such as electricity, gas and water. Services includes trade, hotels and restaurants, transport, storage, communications, finance, insurance, real estate, business services, and community, social and personal services.

When you fall sick in Nigeria, who pays the bill?
In 2023, households paid directly for 71.9% of Nigeria’s current health expenditure, according to WHO data published by the World Bank. That is about ₦72 of every ₦100 spent on healthcare, the highest share among 54 African countries.
These out-of-pocket payments include consultation fees, laboratory tests, medicines and hospital care paid for directly by households. The money may come from a salary, savings or contributions from relatives, without reimbursement from insurance or another organisation.
Cameroon followed Nigeria at 67.7%, then Equatorial Guinea at 66.0%. Across Africa, 13 countries relied on direct household payments for more than half of their current health spending.
At the other end, out-of-pocket payments accounted for just 4.1% in Rwanda, 4.3% in Botswana, 6.7% in South Africa and 7.5% in Namibia. Nigeria’s share was more than double the sub-Saharan African figure of 30.4% and more than four times the global figure of 17.3%.
Paying directly for healthcare can leave families choosing between treatment and other basic needs. Those who cannot afford the bill may delay care or go without it, risking worse health and higher costs later.

Agriculture accounted for more than half of employment in Nigeria in 1991. By 2025, its share had fallen to a third, according to modelled ILO estimates published by the World Bank.
Over the same period, services’ share rose from 36.1% to 49.5%, recording the largest increase among the three broad sectors. Industry’s share also increased, from 10.1% to 17.0%.
Across the 34 years, agriculture’s share fell by 20.31 percentage points, while services and industry gained 13.38 and 6.93 percentage points, respectively.
Note: Agriculture includes farming, hunting, forestry and fishing. Industry includes mining and quarrying, manufacturing, construction, and public utilities such as electricity, gas and water. Services includes trade, hotels and restaurants, transport, storage, communications, finance, insurance, real estate, business services, and community, social and personal services.
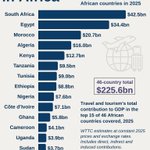
South Africa and Egypt together accounted for $76.9 billion in travel and tourism’s economic contribution in 2025, roughly a third of the $225.6 billion total across the 46 African countries covered.
South Africa led with $42.5 billion, followed by Egypt at $34.4 billion. Adding Morocco’s $20.7 billion and Algeria’s $16 billion brings the four countries’ combined contribution to $113.6 billion, slightly more than half the total across all 46 countries.
Nigeria ranked ninth among the countries covered, at $7.6 billion, behind Ethiopia’s $8.8 billion and ahead of Côte d’Ivoire’s $7.1 billion. It had the largest contribution among the West African countries included, with Ghana following Côte d’Ivoire at $5.8 billion.
These figures measure the economic value supported by travel and tourism, including its direct activity, supply chains and spending by workers whose jobs it supports. They cover domestic and international travel, rather than foreign visitor spending alone.
All figures are WTTC estimates at constant 2025 prices and exchange rates. Totals and shares for the 46 countries were calculated by Intelpoint.
Source: World Travel & Tourism Council: Travel & Tourism Economic Impact Research 2026. All rights reserved.

For every ₦100 international visitors spent in Nigeria in 2019, they spent about ₦49 in 2025, after adjusting for inflation.
The World Travel & Tourism Council (WTTC) estimates that international visitor spending fell 51.3%, from ₦947.1 billion to ₦461 billion over those six years. After recovering to about ₦73 per ₦100 of its 2019 level in 2022, it fell for three consecutive years, including an 18.6% drop in 2025.
Domestic visitor spending moved the other way, rising 10.6% between 2019 and 2025 to ₦6.39 trillion. That is about 1.7% growth a year, compounded. In 2025, domestic spending accounted for roughly ₦93 of every ₦100 spent on travel and tourism within Nigeria, across business and leisure trips.
All spending figures are WTTC estimates at constant 2025 prices. The per-₦100 comparisons and compounded annual growth rate were calculated by Intelpoint from WTTC data.
Source: World Travel & Tourism Council: Travel & Tourism Economic Impact Research 2026. All rights reserved.
Intelpoint retweeted
More than nine in ten employed people in Djibouti worked in services in 2025, at 92.2%, covering activities such as wholesale and retail trade, transport, hotels and restaurants, finance, education, healthcare and public administration.
According to World Bank data based on modelled ILO estimates, services accounted for more than half of employment in 18 African countries. Mauritius, South Africa and Libya followed Djibouti, each with shares above 70%.
Nigeria’s share stood at 49.5%, above sub-Saharan Africa’s 38.5%, but slightly below the global share of 50.6%.

Intelpoint retweeted
South Africa has 5,230 fewer ATMs than at its 2016 peak. Nigeria has 2,055 fewer than in 2019.
They top the 18 African countries with fewer ATMs in 2025 than at their recorded peak, ranked here by machines lost. The other 23 of the 41 countries with 2025 data recorded their highest ATM count in the series that year.
Seven of the top 10 countries peaked between 2016 and 2020, while Tanzania and Namibia peaked in 2024.
40 of the 49 African countries with a 2017 value and a later reported value had more ATMs in their latest reported year than in 2017.
Peak = highest value in each country’s available series since 2004; some series start later.

More than nine in ten employed people in Djibouti worked in services in 2025, at 92.2%, covering activities such as wholesale and retail trade, transport, hotels and restaurants, finance, education, healthcare and public administration.
According to World Bank data based on modelled ILO estimates, services accounted for more than half of employment in 18 African countries. Mauritius, South Africa and Libya followed Djibouti, each with shares above 70%.
Nigeria’s share stood at 49.5%, above sub-Saharan Africa’s 38.5%, but slightly below the global share of 50.6%.
South Africa has 5,230 fewer ATMs than at its 2016 peak. Nigeria has 2,055 fewer than in 2019.
They top the 18 African countries with fewer ATMs in 2025 than at their recorded peak, ranked here by machines lost. The other 23 of the 41 countries with 2025 data recorded their highest ATM count in the series that year.
Seven of the top 10 countries peaked between 2016 and 2020, while Tanzania and Namibia peaked in 2024.
40 of the 49 African countries with a 2017 value and a later reported value had more ATMs in their latest reported year than in 2017.
Peak = highest value in each country’s available series since 2004; some series start later.
Intelpoint retweeted
Roughly one in four employed people worldwide worked in agriculture in 2025, representing 25.8% of total employment.
As the world marks World Food Day today, the figure offers a look at how important agriculture remains to livelihoods around the world.
In Burundi, 85.3% of employment was in agriculture, more than three times the global share. Mozambique and Niger followed at about 73% each.
Overall, 19 African countries had more than half of their employment in agriculture, while the Sub-Saharan Africa average stood at 49.3%.
Nigeria stood at 33.5%, above the global average but well below the Sub-Saharan Africa average.
Intelpoint retweeted
In Lagos, 87% of children aged 7–14 had foundational reading skills in 2021, compared with just 2% in Jigawa. That is an 85 percentage-point gap between the two states.
Across Nigeria, the share was 26.8%. Eighteen of the 37 areas, including the FCT, recorded higher rates, and 16 of those were in the South West, South East or South South. Kwara and the FCT were the only areas outside those three southern zones above the national average.
The figures come from Nigeria’s 2021 Multiple Indicator Cluster Survey (MICS6) and are available at the subnational level through UNICEF’s Foundational Learning Skills explorer. The assessment covered children aged 7–14, including those who were out of school. For reading, children had to read at least 90 per cent of a short Grade 2-level story and answer both literal and inferential comprehension questions.

Intelpoint retweeted
Africa had a strong presence among the currencies requiring the most local currency units to buy $1 in 2025.
Eleven African currencies featured among the 25 shown, accounting for 44% of the list. Somalia’s shilling led the African group at 24,300 per dollar, followed by Guinea at 8,663, Madagascar at 4,530 and Uganda at 3,596.
The naira also featured on the list, averaging 1,518 per US$1 in 2025. Iran was the clear outlier globally, with the dollar averaging 711,418 Iranian rials, nearly eight times Lebanon’s 89,500.
Using the UN M49 subregional classification, 7 of the 11 African countries were in Eastern Africa: Burundi, Madagascar, Malawi, Rwanda, Somalia, Tanzania and Uganda. The remaining four were Nigeria and Guinea in Western Africa, the Democratic Republic of the Congo in Middle Africa, and Sudan in Northern Africa.

Intelpoint retweeted
New data from the UNDP/OPHI Global MPI report shows Nigeria’s multidimensional poverty rate rose significantly from 33.0% in 2021 to 38.7% in 2024—affecting nearly 4 in 10 Nigerians (90.1M people).
While the timeline tracks this specific comparative trend, the UN's broader, comprehensive baseline estimate for the country is even more severe: it reveals that 48.7% of the population—approximately 113 million Nigerians—were living in multidimensional poverty.
Multidimensional poverty measures deprivation in health, education and living standards, not income.

Africa had a strong presence among the currencies requiring the most local currency units to buy $1 in 2025.
Eleven African currencies featured among the 25 shown, accounting for 44% of the list. Somalia’s shilling led the African group at 24,300 per dollar, followed by Guinea at 8,663, Madagascar at 4,530 and Uganda at 3,596.
The naira also featured on the list, averaging 1,518 per US$1 in 2025. Iran was the clear outlier globally, with the dollar averaging 711,418 Iranian rials, nearly eight times Lebanon’s 89,500.
Using the UN M49 subregional classification, 7 of the 11 African countries were in Eastern Africa: Burundi, Madagascar, Malawi, Rwanda, Somalia, Tanzania and Uganda. The remaining four were Nigeria and Guinea in Western Africa, the Democratic Republic of the Congo in Middle Africa, and Sudan in Northern Africa.
Intelpoint retweeted
Where a child lives in Nigeria is closely tied to whether they have foundational numeracy skills.
In Lagos, 82.3% of children aged 7–14 had foundational numeracy skills in 2021. In Jigawa, it was just 0.8%. Across Nigeria, the figure was 25.3%.
Of the 18 jurisdictions above the national figure, 15 were in the South. In 11 northern states, fewer than 12% of children had foundational numeracy skills.
This measures the minimum numeracy standard expected at the Grade 2–3 level, assessed one-on-one with a randomly selected child aged 7–14 per household. The sample includes children who were not in school.
These are survey estimates with margins of error. For example, Taraba's estimate was 9.5%, with a 95% confidence interval of 6.0%–14.7%. Small differences between states may therefore not be statistically meaningful.

New data from the UNDP/OPHI Global MPI report shows Nigeria’s multidimensional poverty rate rose significantly from 33.0% in 2021 to 38.7% in 2024—affecting nearly 4 in 10 Nigerians (90.1M people).
While the timeline tracks this specific comparative trend, the UN's broader, comprehensive baseline estimate for the country is even more severe: it reveals that 48.7% of the population—approximately 113 million Nigerians—were living in multidimensional poverty.
Multidimensional poverty measures deprivation in health, education and living standards, not income.
Intelpoint retweeted
Nigeria is adding people faster than it is adding ATMs, and the gap keeps widening.
In 2019, the country had 19,459 ATMs, its peak. By 2025 that was down to 17,404, which is 2,055 fewer machines, a drop of 10.6%. ATMs per 100,000 adults fell from 16.4 to 12.3, a 24.7% drop, because the adult population kept growing. That is lower than Nigeria’s 2013 level and the lowest since 2012.
Between 2009 and 2014, the network grew from 9,907 machines to 15,935, up 61%. Coverage then held at around 15 to 16 per 100,000 adults until 2021, so the network was at least keeping pace.
Since then, coverage has fallen four years in a row. The machine count has hardly moved since 2023, from 17,377 to 17,404, so the slide now comes from a growing population sharing the same machines.
