

Crypto and macro, every morning.
- Tweets8.1K
- Following1.6K
- Followers5.8K
- Likes144K






ALT Bar chart of Deribit implied volatility for the Nov 27 bitcoin expiry: the 25-delta $71,000 put at 42.73%, at the money 38.04%, the 25-delta $81,000 call at 36.46%. Downside puts cost 6.27 vol points more than upside calls.

ALT Histogram of Applied Materials' six-session price move around each of 122 earnings reports since 1996. Most moves are under 8%, median 4.4%. A white dashed line at 12.4% marks what the 13 Nov straddle prices; only 8 reports moved more.

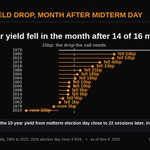
ALT Lollipop chart: drop in the US 10-year Treasury yield, in basis points, from midterm election day close to 22 sessions later, 1962 to 2022. Fell in 14 of 16: 1970 97bp, 1990 54, 2022 53, 1974 40, 2018 33, 1986 21, 1966 18, 1994 16, 1982 10, 2006 10, 1998 9, 2014 9, 2002 4, 1962 1. Rose in 1978 (5bp) and 2010 (32bp). Dashed line at 15bp, the drop needed for the call. 2026 election day close 4.95%. Source: FRED DGS10.

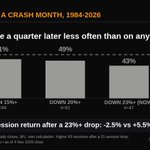
ALT Bar chart: share of times Micron (MU) was higher 63 trading sessions after a 21-session drop, 1984 to 2026, non-overlapping episodes. After drops of 15% or more: 51% (n=84). 20% or more: 49% (n=61). 23% or more, which includes today's 23.9% drop: 43% (n=47). Dashed line: 57.2% for any day. Median 63-session return after a 23%+ drop was -2.5% vs +5.5% for any day. Yahoo Finance daily closes to 4 Nov 2026.

ALT Bar chart: after 11 past 20-session gaps of 15 points or more between XLK and XLV since 1998, XLK did worse than XLV over the next 20 sessions 64% of the time, next 40 sessions 73%, next 63 sessions 73%, against 48% for any 40 sessions. Since 2024, 1 of 3 episodes. Current gap 24.7 points as of the 4 Nov 2026 close.

ALT Bar chart: after a 40%+ one-day VIX jump since 1990 (n=19), VIX was 25%+ lower 21 sessions later 58% of the time; 50%+ jumps 60% (n=10); 40%+ jumps since 2004 69% (n=16); versus 6.6% on any day.


ALT Bar chart: after 28 KOSPI drops of 4.5% or more since 2000, EWY was 5%+ higher 20 sessions later 61% of the time (78% since 2020, n=9), against a 29% base rate for any 20 sessions; any 20 sessions in 2026 ran 47%.


ALT Bar chart: share of past days when the chip ETF SMH fell 1% or more while SPY rose 1% or more (21 days since 2000, 10+ sessions apart) where SMH closed 5% or more higher 20 sessions later. All 21: 52%. 2000-2009: 41% (n=17). 2011-2022: 100% (n=4). Dashed line: 30% for any 20-session window. As of 4 Nov 2026 close. Source: Yahoo Finance SMH and SPY daily adjusted closes.


ALT Bar chart: share of past VIX crushes (one-day drop of 15% or more to a close below 20, 42 events since 1990) where VIX was above the crush close 1, 2, 3, 5 and 10 trading days later: 40%, 45%, 45%, 24%, 38%, against 47% on any day. As of Nov 4 2026 close, 16.61, down 20%. Source: Cboe VIX via Yahoo daily closes.


ALT Bar chart: share of days bitcoin's realized volatility over the next 30 days topped 39.7%, the implied vol options charge today, grouped by the prior 30 days' realized vol, Jan 2025 to Nov 3 2026. Prior month under 30%: 65% (124 days). 30 to 40%: 27% (199). Over 40%: 49% (319). Dashed line: any day since 2025, 45%. Last 30 days realized 28.2%. Source: Coinbase BTC-USD daily closes; implied vol from Block Scholes.

ALT Bar chart: share of US staples stocks back above their pre-drop close 60 sessions after an 8%+ earnings-day gap down. All 2003-2026: 24.5% (n=139). 2010-2026: 24.1% (n=112). Drops of 8-10.5%: 24.1% (n=79). Sysco, any 8%+ drop: 0% (n=6). Dashed base rate, any day rallying 10.3% in 60 sessions: 23.7%.

ALT Dot plot: since 1950, after a 1.5%+ S&P 500 rip within a week of a close 2 standard deviations below its 50-day average, the index was higher a month later 60% of the time vs 62% on any day, and fell 5%+ within a month 22% of the time vs 15%.


ALT Bar chart: share of times WTI crude closed at least 10% above its crash-day close within 21 sessions, after a 4-session fall, 1986 to 2026. Fell 10%+: 48% (81 episodes). Fell 11%+: 54% (65). Fell 12%+: 54% (55). Fell 15%+: 78% (27). Dashed line: any month, 28%. Source: FRED DCOILWTICO to 27 Oct 2026, Yahoo CL=F front month after.


ALT Bar chart: share of times the consumer staples ETF XLP was higher 63 trading sessions later, after a 21-session gain of at least 5%, 6% or 7%, 1998 to 2026. After +5%: 60% (57 episodes). After +6%: 57% (44). After +7%: 47% (32). Dashed line: any 63-session window, 71%. XLP rose 9.8% in the 21 sessions to the 3 Nov 2026 close. Source: Yahoo Finance adjusted closes.