

We rank macro assets from over/undervalued using relative valuations and sound money cycles. Your 10k foot macro view. (NotFinancialAdvice)
USA
Joined March 2015
- Tweets924
- Following186
- Followers205
- Likes338






Pinned Tweet
What we do:
--Comprehensive Relative Macro Asset Valuations--
We rank macro asset classes from over to undervalued using 100 years of historical data (beyond what's available on TradingView). We simply divide every macro asset against each other in every combination. This gives the clearest ten thousand foot view of which asset classes are 'relatively' under/over valued.
What we've discovered:
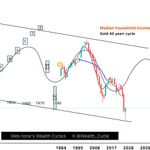
--Gold 40-year cycle--
Most know about the bitcoin 4-year cycle, but I've independently discovered a 40 year cycle in gold (that just peaked). I use both forms of sound money to measure prices.
102
FEAR and GREED.
Both are negative/dark emotions.
You will lose money acting on these emotions, as I have done. Fear based decision making in life and in the markets will destroy you. Dark energy will ruin you.
The markets have taught me a lot about myself, including highlighting my fear-based relationship with money. This has caused me to lose everything in the markets.
For some, the markets are about money only. For me it has become a spiritual journey, requiring me to face my greatest fears head on. Even though I am developing a methodology which intellectually guides me, action still requires facing extreme fears, and uncertainty still exists. One still must be ever-defensive, without being fearful.
So what is the opposite of FEAR and GREED? How can I approach the markets with LOVE and GENEROSITY?
This goes back to the core job description of a trader: reducing market volatility. Allocating capital where it is needed most. Dampening extremes. Acting as a stabilizing force to the markets and therefore to society. If we do this well, we are compensated well. If we do this poorly, we literally pay the price.
That is the goal of Wealth Cycles, to help clarify which markets need our help. To ID where we can figuratively spread our financial light and love in dark and depressed markets.
YIN/YANG, LIGHT/DARKNESS, EXPANSION/CONTRACTION... Everything works this way, because everything is energy. Everything is music. Everything has cycles because everything is a waveform.
I've also just described the nature of Wes-tone's Wealth Cycles name and imagery.
1
2
54


If median US homes appreciate at the same rate until the gold 40 year cycle bottom, they'll be ~700k by 2038.
If the median home/gold ratio reverts to cycle extreme highs, gold would hit $1,000 /oz by 2038.
Notice how little gold has crashed so far relative to median home prices.


1
83
Everyone hates fiat, until you get a liquidity crunch, then you wished you had more of it.
What we do at Wealth Cycles is first compare relative asset valuations (which asset classes are over/under valued relative to each other). This tells which assets will likely outperform other assets.
Then we also look at fiat liquidity metrics, which tell us when we should favor fiat over assets. The last several weeks is one of those times to favor fiat.
And liquidity doesn't appear to be turning around yet. But when it does, it's helpful to know which asset classes to deploy that capital to. We have our eye on bitcoin and altcoins as the highest performing asset for the next couple years.
Other areas of undervaluation are median homes, oil, and median incomes.
1
17
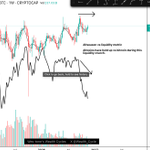
Altseason vs liquidity:
Stocks, metals, crypto, oil.. everything comes down in a liquidity crunch. That's what a liquidity crunch is, a contraction in fiat.
However, during this crunch, altcoins have not underperformed bitcoin...so far. Until that changes, that is a good reaffirming sign that when liquidity turns upwards, altseason will likely be upon us.

1
51
Truly brutal price action for metals and crypto. But factoring in liquidity, and the fiat contraction we're experiencing, nothing is really broken.
1
52
The Wealth Cycles methodology is based on a comprehensive relative asset valuation comparison, and measuring asset prices using sound money (btc, gold).
However, fiat still exists and the best time to prefer fiat is during liquidity contractions like those we're experiencing now.
Fiat IS government debt. With interest rates exploding higher from zero just a few years ago, and gov debt at unsustainable levels, the natural path is toward a deflationary debt implosion.
When asset prices deflate to jarring levels, central planners step in and fill that fiat hole with 'liquidity'. We might be falling into that big hole now that will require the largest QE ever. QE is also closely correlated with 'altseason'.
Even though crypto will be one of the best performing asset class for the next 2 years relative to other major asset classes, I still have to be concerned with my fiat entry, since that is what I have to trade from.
For this reason I will not be entering that trade until the liquidity metrics deem it favorable. Even though the bitcoin cycle is just turning up, and altseason is just turning up, liquidity is contracting so I must be fairly sure that it starts turning up also. Mis-timing liquidity could mean another 20-30% drawdown measured in fiat.
1
33
On why the bitcoin power law 'support level' is not a function of the true power law calculation

Here we go again:
1) The power law has no bottom.
Correct. The support line is an additional phenomenon, not an intrinsic part of the power law. It is a rather remarkable empirical observation that Bitcoin's price has historically rarely fallen more than approximately 60% below the power-law trend.
This is a separate, second-order statistical phenomenon, independent of the underlying power-law relationship.
2) The support line is statistical, not an inviolable boundary.
Its mathematical meaning is that Bitcoin spends very little time below this threshold, not that crossing it is impossible. What matters is the statistical distribution of the time spent in different regions relative to the trend.
A support line is not a physical barrier. It characterizes the probability of observing certain price deviations.
3) We have explicitly defined invalidation criteria.
These criteria are presented in our published article. The relevant timescales are measured in years, not days.
This is not a cop-out. It follows from the mathematics of scale-invariant phenomena and the relatively young age of Bitcoin. A few days or weeks of price action cannot meaningfully invalidate a relationship that describes nearly two decades of long-term evolution.
4) The SBI Observatory will make all of this transparent.
We expect to launch the public Scientific Bitcoin Institute Observatory by the end of this month.
It will provide the relevant indicators and statistical parameters needed to continuously evaluate how well Bitcoin's power-law model holds up against empirical data.
The goal is not to defend the model at all costs, but to make its predictions, deviations, and potential invalidation transparent, measurable, and scientifically testable.
1
34
Brutal time for gold and silver, but the 40 cycle has peaked and it's going to be brutal for at least 12 more years.
43
Bitcoin and many altcoins are nearing significant and clear support levels. However markets often create traps out of these kinds of areas. Given that the liquidity metrics are still contracting, it is very within the realm of possibility for these traps to become ideal entry points.
Will we get there? Idk. More likely if liquidity continues down.
But markets have a way of screwing the most people in the worst way. That would be the most brutal price action I could think of.
My goal is not to execute for you. My goal is to show you where to look for opportunities using our methodology. And crypto will likely be the best performing asset for the next 2 years regardless of perfect entry.


5
63
The point of the gold 40 year cycle is not necessarily to cash out. It’s to invest in other assets that will outperform.
The cycle is not even visible measured in fiat. It’s only visible relative to other assets and metrics.
1
58
Adjusting our worst case scenario downward to <= 60k:
-the liquidity metric has not turned around yet definitively
-There is still a very feasible 10% downside in the btc/liquidity tightness metric
-There is a massive liquidation level at 60k
-Major stop loss orders presumably below 58-60k.
If we manage to take out the previous lows in bitcoin and several altcoins, that would be a godsend entry, and absolutely the most brutal shakeout for those who are long. So that would be our best case buying scenario.
One step at a time is all we can do.

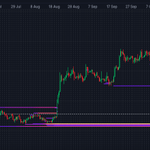
The bitcoin structure map:
-The cycle bottom is turning up (dotted line), but still bottom forming. (Based on signal clarifying 52-week SMA estimate)
-Any move downward below the dotted line is counter cycle and will act as a slingshot.
-Volume profile shows air pocket below 75k to 71k.
-Highest likelihood accumulation range from 66-71k, worst case ~ 62.5k (pending our liquidity metrics)
-Power law support level ~67k, aligning with profile VAL, and near value area POC.

2
67
Bitcoin cycle has bottomed relative to nearly all macro assets. So if you’re trading from another asset this is prime time to get into bitcoin.
Next question is whether it’s bottomed relative to fiat.
Any downside in bitcoin from here is largely a fiat liquidity issue and not a bitcoin cycle issue.
The cycle itself is no more than a couple weeks or months from slingshotting higher.
Any major liquidity crunches will be backfilled by the fed.
The current crunch is significant but not yet extreme and where it goes from here is hard to say.
However, short term,BTC/liquidity is still elevated a bit. So it’s a balancing game between the two. Liquidity could turn higher, BTC could continue lower, or a combination of the two. Or both could continue lower.
The dotted idealized cycle is like a magnet. So price should balance around it. That’s how we knew a big short was coming.
We’ll keep watching these charts.


5
99
Both liquidity metrics appear to be just starting to lose momentum. Though cycles here are fairly loose and hard to predict. If liquidity continues to tighten it will enter extreme territory before too long.


34
Oil prices are very undervalued relative to other macro assets. Does that mean they will imminently break above the $100-120/barrel range? No, just because prices are cheap doesn't mean prices can't remain undervalued or go lower in the short/medium term.
Without knowing the fundamentals of the oil business, we can still gather clues. Fundamental analysis is very difficult and plenty of extremely smart people remain dogmatic about why this or that asset should go higher and it never does. You see it in gold right now despite the crystal clarity of the 40 year cycle.
I personally suspect we are at a medium term top in oil because of sentiment. People are widely talking about how expensive gas is, and that corroborates with google search terms for 'gas prices' having recently hit extremes only seen two other times in the last 20 years.
The recent rejection of $100/barrel was significant, and corroborates with my sentiment observation which suggests a medium term top.
I can't tell you how to execute, only show you some signs. I will be looking for opportunities when oil gets back into the 60's and 70's, sometime within the next couple years. From there a breakout of the $100-120 range could send us to $400-500/barrel, as there have been 2 other periods where oil has done 10x.
We can only play one step at a time. I will be very wrong making so many predictions. But in the meantime, however, I only need to be confident that crypto will offer far better returns until opportunities in oil outweigh them.


1
47
What value do traders provide to society?
In a free market, the more market value you contribute to others, the wealthier you (and others) will be. It's easy to see how a potato farmer who grows more potatoes no only enriches himself but also provides abundance to his community.
Traders can make a lot of money, so they must be contributing a lot to society, right?
So what value do traders provide to society? Aren't we all bunch of degenerate gamblers? Trading is distinctly different than investing.
The answer is reduction in market volatility.
Good traders reduce market volatility, and bad traders increase it. And this is a stabilizing force to society. Stable markets are systematically good for an economy. If you're struggling with trading, remember what your fundamental purpose is.
35
Why the Shiller CAPE ratio and Case-shiller home price index are flawed:
CAPE ratio= Cyclically adjusted PE ratio. It measures historical stock price to earnings ratios but uses *inflation adjusted* earnings. The inflation adjustment is an estimate using the CPI. Estimating fiat inflation is a source of error, and the CPI has not been calculated consistently since its inception. There is also an incentive for governments to understate inflation. The current CAPE ratio shows extremely extreme overvaluation of stocks.
Home Price Index: Similar 'inflation adjusted', CPI based calculation which appears to show an unbelievable overvaluation bubble.
This problem goes for any economic data that says 'real' or 'inflation adjusted' as they are likely linked to the CPI and are inherently guesswork.
Both of Shillers' charts show that prices become radically dislodged from their 100-year historical mean around the 1990's. They have remained extremely elevated since then.
Using the Wealth Cycles comprehensive relative valuation method eliminates the source of CPI estimation and error. It makes more sense to measure asset prices relative to each other, directly, because you fully eliminate fiat from the equation. When doing so, neither stocks nor homes have diverged so radically. They maintain a relatively stable oscillation between a pretty predictable price channel. In fact, when using gold as a measuring stick, home prices are currently at dead bottom, and the price channel is a near perfect 100+year horizontal sine wave.
Fiat really is a terrible measuring stick and ought not be the primary measuring stick for measuring asset prices.


74
The bitcoin structure map:
-The cycle bottom is turning up (dotted line), but still bottom forming. (Based on signal clarifying 52-week SMA estimate)
-Any move downward below the dotted line is counter cycle and will act as a slingshot.
-Volume profile shows air pocket below 75k to 71k.
-Highest likelihood accumulation range from 66-71k, worst case ~ 62.5k (pending our liquidity metrics)
-Power law support level ~67k, aligning with profile VAL, and near value area POC.