

Important support and resistance levels to watch when selling options or LPing tokenized stocks.
Joined September 2026
- Tweets33
- Following34
- Followers34
- Likes25




Which Strike retweeted

This is how you use AiFi:
1. Connect the @coinbase MCP so your agent can trade on Coinbase.
2. Ask the @coinbase MCP to pull the latest stock picks from dripstack.com (@trydrip), which aggregates daily picks and trades from top financial newsletters.
3. Have your agent read themarkets.today to understand what’s moving markets.
4. Ask your agent to compare the picks against that context, explain its choice, and buy your chosen stock on @coinbase.
Which Strike retweeted
We just killed Morning Brew.
A free daily stock market brief for your agent, combining the best insights from top newsletters and podcasts.
Tell your agent:
“Read themarkets.today every morning and tell me what matters.”

Which Strike retweeted

➥ Project Spotlight - Week 38/2026
Here are 9 handpicked projects you'll want to explore.
➢ @scalar_field_
➢ @sharexyz
➢ @trasiaxyz
➢ @Payward
➢ @WhichStrike
➢ @Perk_Money
➢ @AssetoFinance
➢ @UsePaid
➢ @DeedEstate
Below you will find brief summaries for each.
Let's dive in!
…
— 📌 | Scalar
SEC-registered internet financial adviser to backtest and deploy agents across US equities, @Polymarket, @HyperliquidX perps, and @JupiterExchange. Raised about $500k seed; Pioneer Fund and Tekedia Capital on the cap table.
…
— 📌 | Share
Prediction-market social trading app. Current pitch: the interface for Hyperliquid Predictions (HIP-4), with routing across Hyperliquid + Polymarket, claimed fee savings of up to 100x vs Polymarket, 0% Share fees, and points toward $SHARE. Also tied into @Outcomexyz’s $1M rewards
…
— 📌 | Trasia
Asia-first perp trading front end on Hyperliquid. $1.75M seed from Multicoin (first HL ecosystem check). Co-founded by former Multicoin partner Mable Jiang. After launch they posted ~$353M volume / ~$172k revenue in ~24 days.
…
— 📌 | Payward
Parent of @krakenfx, @NinjaTrader, @xStocksFi, @breakoutprop, @CFBenchmarks. Shared infra for trading, tokenized equities, and payments. Recently building permissioned HIP-3 markets for US Clients.
…
— 📌 | Which Strike
Tools to analyze support/resistance and GEX levels for selling options or LPing tokenized stocks on @RobinhoodCrypto Chain, built by @blauyourmind (creator of @trydrip)
…
— 📌 | Perk
Solana token + rewards shop: hold $PERK for credits, burn for premium items, removed PERK entirely from the circulations. Launched on @Pumpfun.
…
— 📌 | Asseto
Compliant RWA launchpad that tokenizes funds and strategies (MMFs, credit, arb) for DeFi. ~$310M in distributed RWA asset value.
Recently launched NGI+ on @pendle_fi: an on-chain token backed by interests in a private infrastructure equity fund, linked to the NAV performance of the @partnersgroup Next Generation Infrastructure strategy.
…
— 📌 | Paid
Routes pumpfun and @ponsdotfamily creator fees to any X handle via @XMoney. 80% paid in USD to the named account, 20% buys and burns $PAID
…
— 📌 | Deed Estate
Deed is a yield-generating real estate offering on Robinhood Chain, pitched as earning property income without the landlord headaches, packaged in an ETF-style wrapper set to land on Robinhood Crypto.

Which Strike MCP is live!
Connect your AI agent to whichstrike.com to pull daily support and resistance levels and expected move ranges for stocks.
If you are building an agentic trading system, Which Strike will give your agent more context for choosing strikes!
14
9
97
Find the stocks the top analysts are watching...and then find their support and resistance levels on whichstrike.com
This quoted post is unavailable.
1
2
58
Which Strike retweeted
Which Strike MCP is live!
Connect your AI agent to whichstrike.com to pull daily support and resistance levels and expected move ranges for stocks.
If you are building an agentic trading system, Which Strike will give your agent more context for choosing options strikes and planning trades.

Which Strike retweeted
How I use Which Strike when trading options
I built whichstrike.com because I wanted an easier way to compare support and resistance levels and track expected price moves when choosing option strikes to sell. These are areas where a stock’s price might find buying interest on the way down or selling pressure on the way up.
If you’re getting into onchain options, options trading in general, or LPing stock tokens, you might find it useful too.
Many analytics platforms hide these indicators behind complex filters and tabs. I wanted a simple table and graphic I could quickly scan to see which levels were close together.
Here’s how I use it when considering selling a put option.
First, I choose when I want the option to expire. I usually look at expirations around 7 to 30 days away.
Then I check the implied volatility (IV) expected move for that timeframe on Which Strike. This uses current options prices to estimate how far a stock could move up or down over that timeframe. Which Strike shows 7-day, 14-day, and 30-day IV expected moves by default.
There are three related terms here:
Historical volatility: how much the stock moved in the past.
Implied volatility: how much movement options are pricing in now.
Realized volatility: how much the stock actually moves over the period you’re evaluating.
Implied volatility is a useful starting point because it reflects the market’s current expectations for future movement. Historical volatility gives me context, but it only looks backward.
Implied volatility often ends up being higher than realized volatility. In other words, options can price in more movement than actually happens. That’s part of what makes selling options interesting to me.
Which Strike uses IV to calculate a one-standard-deviation price range. That means roughly a 68% chance the stock finishes inside that range at the end of the chosen timeframe.
For example, imagine a stock is trading at $100. Its 30-day IV expected move is $7 in either direction, giving me an estimated range of $93 to $107.
The model estimates roughly:
A 68% chance of finishing between $93 and $107.
A 16% chance of finishing below $93.
A 16% chance of finishing above $107.
Since I’m considering selling a put, I focus on the lower end: $93.
Next, I check the 50-day and 200-day moving averages (also visible by default on Which Strike). These track the stock’s average closing price over the past 50 or 200 trading days. I watch them as potential support levels.
Let’s say the stock’s 200-day moving average is at $92. Now I have two nearby levels to consider:
$93: the lower end of the 30-day IV expected move.
$92: the 200-day moving average.
That would get me looking at put strikes below $92, placing the strike below both levels.
Seeing these price levels together on Which Strike helps me understand why I’d consider one strike over another. I still need to decide whether the premium I’d collect by selling the put option is worth the risk, but it gives me a clearer starting point.
Intraday, I also watch the daily Fibonacci support and resistance levels. Personally, I’ve found them surprisingly useful, though I mostly use them for quick day trades.
More recently, I’ve been exploring GEX, or gamma exposure, which is why I added it to Which Strike.
Honestly, I’m still figuring out how useful it is in my own trading.
The basic idea is this: as a stock moves, options dealers may need to adjust their hedges. Depending on their positioning, that activity can amplify or dampen the move.
When dealers are short gamma, or have negative gamma exposure, hedging can involve buying as price rises and selling as it falls. That can add momentum in either direction (think about the GameStop situation here).
When dealers are long gamma, or have positive gamma exposure, hedging can involve selling as price rises and buying as it falls. That can help dampen moves and sometimes contribute to price “pinning” near certain strikes.
That’s the high-level reasoning behind watching GEX levels. But GEX estimates rely on assumptions about dealer positioning that may or may not be accurate. For example, the standard GEX model assumes retail traders are net sellers of calls. I am not sure how true that is in practice (i.e., GameStop).
There are more indicators on Which Strike, but the above is how I use it today: start with an expiration, check the expected move, and look for nearby support and resistance levels to help me evaluate potential strikes.
If there’s a support or resistance indicator you think I’m missing, I’d love to hear about it.

🔥🔥🔥

$IBIT and $ETHA options markets are huge and can tell you a lot about key $BTC and $ETH price levels.
So I just added a convert button to whichstrike.com so you can translate $IBIT support and resistance levels into equivalent $BTC prices (same with $ETHA => $ETH).
If you are trading options on @DeriveXYZ, this tool might be useful to you 👀

2
2
73
Which Strike retweeted
You can tell your @Muse or Instinct or @bot to watch important support and resistance levels on whichstrike.com and notify you when a stock you care about hits an important support or resistance :)
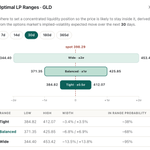
Current optimal liquidity ranges for people LPing USDG/ robinhood:0xc9a981fee1f9dec688bb123ccdecc63d0debfc4e on @Uniswap on @RobinhoodApp chain.

25
19
193
👀👀👀

Selling options and LPing tokenized stocks are the same problem in different clothes.
You need price levels that matter — then you set the strike or the range around them.
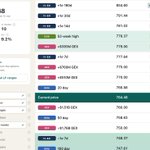
Which Strike stacks those levels for a ticker in one list:
• IV expected move
• moving averages
• 52-week range
• volume at price
• dealer gamma
• max pain
• Fib pivots
• RSI
Green rows = two or more methods land on almost the same price. That’s where you pay attention when picking a strike or an LP range.
$SPY $QQQ $IBIT $GLD $NVDA are free.
whichstrike.com/?ticker=SPY
@WhichStrike
Not a forecast. A map.

28
24
238
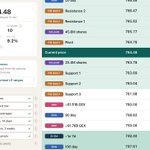
Everyone saying the market is going to crash on Monday. Looking at the support and resistance levels, the large negative GEX and 50 day SMA for
$SPY around $759 will be an interesting point to watch.

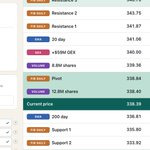
Agreed. Here are some important support and resistance levels for $QQQ


When the Nasdaq trades in a tight 4+ month range like this, you can be sure the next move is going to be explosive.
From compression comes expansion.

1
6
75
These might be some helpful support and resistance levels to look at for $SPY


THE STOCK MARKET IS DUMPING ON NEWS OF DARIO AMODEI SAYING AI NEEDS TO SLOW DOWN
Be ready for Monday. Weekend price action via Liquid

2
46
To be reactive on $QQQ you need to look at the right support and resistance levels.


$QQQ If I was to ask you to make a change, it would be this- “Be reactive”
Market does these three things:
- Moves up
- Moves down
- Consolidates
You just have to react to whatever happens.
It breaks out- you add exposure and enjoy the ride
It breaks down- you dial back the risk by a lot.
It goes sideways- You hold cash and be selective.
People spend way too much time worrying about things that are not in their control.
Nasdaq is going thru this consolidation phase.

1
17
You can see a lot more support and resistance levels for $SPY at whichstrike.com


$SPX Chart Update:
1) Clear and obvious rising channel with multiple touches to the upper bound channel line. Non-debatable that this is a huge technical level.
2) Currently notable RSI bearish divergence similar from Sept 2025-Mar 2026.
3) Did recently break below the mini orange support trendline. Friday we did do a backtest. But can it get over it now? Or will it act as resistance?
4) The lower bound channel line can act as a very likely back stop to any drawdowns for the remaining of the year with 76 trading days left. At any price, the SPX cannot drop any greater than 11% max if that line holds as true support (which I think it will if we do get that Tom Lee drawdown soon).
Did an interim top process/drawdown begin already since making a new ATH in mid August?
Are we going through a historically predictable period where we test new Fed Chair Warsh now with 5% rates and a midterms elections quickly incoming?
Personally, I would love to see a kiss off the lower blue rising channel line for a true and final BTFD moment for the remaining of 2026. At any point, we should remain well over the 7,000-7,100 mark if so.
Buy THAT dip.
-Heis

14
$QQQ hovering around key price pinning and resistance levels around $715 due to strong positive GEX, 20 day SMA, and high volume price levels.
See whichstrike.com for more.

1
1
23
You can see the most important support and resistance levels for $SPY in one place on whichstrike.com


21