

🎩🔎 Teaching you Supply & Demand Trading Exposing the hidden clues in the charts. Founder @ White Oak Trading University 🌳📈 Institutional Logic • Smart Money
www.whiteoakfx.com
Joined June 2010
- Tweets47.2K
- Following4.9K
- Followers15.6K
- Likes20K




Pinned Tweet
Thank you so much for your interest, and congratulations on being open minded and willing to learn. That alone puts you ahead of most traders.
The best way to get involved with what we teach is to start exploring the free resources we put out every day:
📚 Begin by reading the blog posts on our website. They’ll give you a strong foundation in how institutional buying and selling really works.
whiteoakfx.com/blog
📲 Join our free Telegram community where we share real time insights and updates:
t.me/supplydemandforextradin…
🎥 Watch our YouTube videos and dive into the breakdowns we’ve already done. These will help you see the logic behind the markets clearly.
youtube.com/c/WhiteOakFX
🎙 Participate in our morning live sessions. This is where everything comes together and you get to see the analysis unfold in real time.
🔎 One thing I strongly recommend is going through the YouTube sessions where we reviewed the CFTC data. Those videos explain the institutional sentiment behind the markets and will help you understand why price moves the way it does.
youtube.com/watch?v=Crt5i1ic…
If you ever have questions along the way, just let me know. I'm happy to help guide you.
🥇 #GOLD – LOOKING BEYOND THE OBVIOUS: IDENTIFYING INSTITUTIONAL SUPPLY 🕵️♂️
In this video analysis, we examine a supply area on the gold chart that, at first glance, doesn't appear to have the traditional characteristics of a well-established supply zone. So why are we recognising it as institutional supply? 🤔
🏦 It's all about understanding the price action that followed its creation.
Ordinarily, we look for consolidation followed by a decisive departure from the zone. However, in this instance, price rallied sharply almost immediately after the supply area was established, only to reverse just as quickly and resume its decline.
This is not typical of the institutional activity we are looking to identify. Consequently, we generally disregard this type of temporary price behaviour and concentrate on the more meaningful proportional candle formations and structural developments that provide evidence of institutional participation.
📊 The lesson? Don't simply judge a supply or demand zone by its visual appearance. Understanding the price action surrounding its creation is equally important.
That's the beauty of the Sherlock Analysis Process 🕵️♂️ – looking beyond the obvious to understand what the market is really telling us! 🔍
🎩🤷♂️ I bet there's a lot of retail traders scratching their head about #gold. Wondering what the hell is going on and why is price dropping (covered here: youtube.com/live/DO4HJugfqGU…).
Well if you've been following this account you'd know exactly why it's dropping. This is something that we've been expecting for quite some time. All you have to know is institutional supply and demand, how to read the #CFTC data and you know exactly why gold is dropping.

🥇 GOLD – FOLLOW THE CLUES! 🔍
We knew exactly what to watch for as Gold reacted to the 4-hour demand zone.
The next step was very specific: we needed to see a particular 1-hour supply zone removed before considering a potential long signal.
That supply zone was NOT removed. ❌
Instead, we saw 1-hour supply being used to temporarily push price to the downside. And without that critical supply removal, there was NO long signal.
This is why we follow the evidence rather than anticipate what might happen next. The clues are there if you know where to look! 🕵️♂️
Let’s see what unfolds today. We’ll be back next week with some potential trading opportunities.
Until then, let’s keep following the trail until the market gives us a clear signal. 🎯
#Gold #Trading #SupplyAndDemand
🎩☕️ Good morning market magicians! It’s Friday! Level 3 starts in an hour. Congrats to all the new members who took advantage of our Halloween 🎃 sale. You’ve still got time as it expires tomorrow at midnight.

🎩👏 Well done my friend you nailed it!
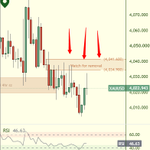
🎩🤷♂️ This is the one hour supply 🟥 zone I'll be watching . If this gets 🚫 taken out and they produce a nice demand 🟩 zone, I'll be looking to enter into a long trade. #gold


🎩🤷♂️ #GOLD - After price hits this four hour demand zone do you know what to watch for on the one hour time frame? If not, you should! This is what we teach you at White Oak Trading University! Let's see if any of you can spot the supply 🟥 zone on the one hour time frame that will signal a long 🟢🚦 signal when it's removed.

🇪🇺🇺🇸 $EURUSD — THE LESSON RETAIL TRADERS NEED TO LEARN! 🔍🎩
🟩 The 4-hour demand zone held!
As we discussed, the euro US dollar made a massive move to the downside, creating a very large red candle. 🔴📉
But what was the real lesson here? 🧐
That massive red candle was enough to trigger retail traders emotionally, convincing many to abandon their long positions. They couldn’t take the heat in the kitchen! 🔥🥵
And now? They’re watching the market move to the upside, exactly as we anticipated! 📈🚀
🎩 This is why you must learn to read the charts, not your emotions!
A large red candle can trigger fear, panic, and poor decisions. But if you understand institutional supply and demand, you can see the bigger picture instead of reacting like the crowd.
🔍 Stop reacting emotionally.
🧠 Start thinking like a professional.
📊 Learn to identify institutional intent.
The market teaches lessons every single day. The question is, are you paying attention?
Learn the lessons, my friends! 🎩🔍💰
#EURUSD #ForexTrading #SupplyAndDemand
🚨🕵️♂️ THE BEFORE & AFTER — THE PROOF IS ON THE CHARTS! 📊🔥
🔥 WATCH THE BEFORE & AFTER HERE: 👇 youtu.be/20sFCw5IKiw
Are you tired of seeing traders claim they predicted a move AFTER it already happened?
In this video, we revisit my ORIGINAL social media posts from the week of October 18th and compare the analysis with what the market did afterward!
📈 GODADDY ($GDDY) — We identified major 🟩 institutional demand around $96 and examined the subsequent move toward $109.
🥇 GOLD ($XAUUSD) — We tracked daily demand through multiple tests, examined what changed when it finally broke, and investigated the new supply zone.
📊 NASDAQ ($QQQ) — We identified weekly demand before the rally and examined the supply zones that needed to be removed for stronger momentum to develop.
💶 EURUSD — We investigate institutional positioning, increasing short exposure, and the four-hour 🟥 supply zone that stood between price and a potential move higher.
🎯 THIS ISN'T ANALYSIS IN HINDSIGHT!
It's about documenting the original analysis, identifying the important zones BEFORE the move, and then reviewing what actually happened.
🕵️♂️ The Sherlock Analysis Process teaches you to identify the chart that's in play, follow the institutional supply and demand storyline, and adjust your expectations when the evidence changes.
📊 Don't just take my word for it. Look at the charts, compare the analysis, and judge the results for yourself!
#SherlockAnalysis #BeforeAndAfter #SupplyAndDemand #InstitutionalTrading #Gold #NASDAQ #EURUSD #ForexTrading #WhiteOakTradingUniversity


🎩🤷♂️ This is what I say to all the retail $EURUSD panickers! youtube.com/watch?v=7nqcgUDo…
🎩🕵️♂️ THE DIFFERENCE BETWEEN A PROFESSIONAL TRADER AND AN EMOTIONAL TRADER
One of the most important skills you must develop as a trader is the ability to keep your emotions under control when the market isn't behaving the way you expected.
Let's take the current US dollar situation and EURUSD as an example. 🇺🇸💶
My analysis has been built around institutional positioning and the need for the banks to work through offloading their short positions. That process doesn't necessarily produce a beautiful, straight-line rally. In fact, the market can look extremely bearish along the way, testing the patience and conviction of anyone who doesn't understand the bigger picture.
And that's precisely what we're witnessing now.
I'm seeing traders across social media becoming increasingly emotional, questioning the analysis, and panicking because price isn't behaving the way they expected.
But has the underlying evidence changed? Has the institutional positioning suddenly disappeared? Has the broader market storyline automatically become invalid simply because price has moved against expectations in the short term?
No. We must evaluate the evidence, not react to our emotions.
🧠 Professional trading requires you to understand the difference between a temporary move in price and a genuine change in the underlying market structure.
That doesn't mean stubbornly defending an analysis when the evidence changes. It means having a logical framework, knowing what would invalidate your thesis, and allowing the market to confirm or contradict your expectations.
📊 The market doesn't owe you the move you expected, and it certainly doesn't care about your feelings.
The traders who constantly change their opinions with every candle, headline, or emotional reaction will struggle to maintain consistency.
Don't confuse patience with stubbornness. Don't confuse a temporary setback with a complete change in direction. And never let fear dictate your decisions.
🎯 Have a plan. Know your invalidation point. Follow the evidence. Control your emotions.
That's how you develop the mindset required to trade professionally.
#SherlockAnalysis #EURUSD #ForexTrading #TradingPsychology #InstitutionalTrading #SupplyAndDemand
$EURUSD As i mentioned to members in yesterdays session, I am planning to hold this positions until mid December if not even later. I am in no rush. I scan through social and traders are freaking out—those holding long positions. THIS IS WHAT ALWAYS HAPPENS! I guess traders don't learn from past situations!
🚨 $EURUSD keeps rates the same. Price ready to rally.

🥇 GOLD: THE MOVE TO THE UPSIDE, JUST AS FORECASTED! 📈🔍
🕵️♂️ We forecasted the move higher, and that’s EXACTLY what happened!
🟥 The 4-hour supply zone was removed, just as we suggested it would be. This opened up the chart for price to move higher! 🎯
🟩 New demand was created, and now we have demand sitting just below price.
🔎 What am I watching next?
I’ll be watching for price to retrace into that demand zone. If price contacts demand, I’ll be looking for the next move toward the daily supply zone! 📈
This is what happens when you follow institutional activity instead of getting distracted by the noise. We identify the zones, forecast the likely move, and then let price confirm the analysis. 🧩🏦
🎩 Analyze charts like Sherlock! The clues are there. You just need to know where to look.
#Gold #Trading #SupplyAndDemand

🎩☕️ Good morning once again!
🤷♂️ Hope some of you profited from the information we provided to you recently. The 📉 drop and 📈 rally on the $EURUSD was so predictable. Just as I said, they did not increase rates BUT they did talk about potentially raising rates next time, which of course is perceived as bullish for the 💵 #dollar, therefore everyone started shorting the 💶 euro.