

Research Intern @Bytedance (San Jose) & Ph.D. student on LLM @UChicagoCS Prev. intern @UWNLP @BerkeleyNLP, BS @XJTU1896 24’
- Tweets148
- Following392
- Followers362
- Likes848




ALT First page of “Evaluating LLM Creativity through Long-Tail Performance” by Yichen Wang, Tenghao Huang, Vishakh Padmakumar, and Mina Lee. Includes the abstract and a diagram showing creativity benchmarks in the long tail of a reference input–output distribution. arXiv:2610.12998.

ALT Table 1 compares ten creativity-promoting methods with a vanilla model. Columns show overall quality, quality at tail (q@Tail, alpha = 25%), overall novelty, and novelty at peak. Most methods increase novelty but reduce tail quality. Min-p raises tail quality by 17.7% while reducing both novelty measures. Subscripts give relative percentage changes; green means increase and red means decrease. Results are averaged across four representative models and the evaluated benchmarks.

ALT Original Figure 5: GPQA-Diamond examples divided into five bins from peak to tail using input–output novelty. The table reports agreement with human creative-writing rankings: Kendall’s tau is 0.099, 0.154, 0.175, 0.396, and 0.222 for bins 1–5. The two highest-tail bins show stronger agreement than bins 1–3.

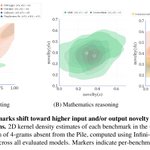
ALT Figure 2 from the paper. Input novelty is on the horizontal axis and output novelty on the vertical axis. Distributions are shown for writing, mathematics, and question answering benchmarks. Creativity benchmarks shift toward higher input novelty, output novelty, or both compared with standard benchmarks. Novelty is the fraction of 4-grams absent from the Pile; output novelty is averaged across evaluated models.


