Logan (@_LNVidal) header
Logan (@_LNVidal) profile picture

Director of Targeting @ Pivot Formerly @DCCC Analytics 2020, 2022 & @Rep_Jimmy. he/him. Go Hokies, Go Badgers!

Washington, DC
Joined July 2017
Photo by Logan (@_LNVidal)Photo by Logan (@_LNVidal)Photo by Logan (@_LNVidal)Photo by Logan (@_LNVidal)Photo by Logan (@_LNVidal)Photo by Logan (@_LNVidal)Photo by Logan (@_LNVidal)Photo by Logan (@_LNVidal)Photo by Logan (@_LNVidal)Photo by Logan (@_LNVidal)
Logan retweeted
All of the handwringing over RCV and Dan Sullivans here will seem so silly when Peltola clears 50% in the first round.
🎶 Dan S. - or even Dan or Gerry. Just don’t rank Mary!
1
1
3
141
Nice to see precinct data line up with my county-level analysis. While this shift is vs. 2020 and mine is vs. 2023, we both find Colom's biggest gains in racially mixed geographies. ebwinter.substack.com/p/the-…
Just looking at persuasion, Mississippi's biggest shift toward Colom came in mixed suburbs and college towns, not in its most Black or most white areas. Shift since 2020, by precinct Black %: Under 10%: 🔵 D+6.7 10–40%: 🔵 D+13.0 40–75%: 🔵 D+10.9 75%+: 🔵 D+2.8
3
2
16
637
The Democratic Party gets a lot of hate but it remains the probably the most electorally effective center left party in the west.
This really is kind of a crazy map.
77
181
23
2,583
90,129
Villegas tips over 100k votes. Unreal midterm turnout (~90% of presidential) in one of the most working class districts in US, giving Villegas 11k more votes than Valadao won in a presidential election year + the largest vote share of any candidate in the district in top-2 era.
#CD22 Update 67.80% - 100,772 - Randy Villegas (Dem) 32.20% - 47,862 - David G. Valadao (Rep)
4
48
6
118
23,397
bro, you’re fine. you just need an impossible sequence of events to play out in perfect order against all odds and you’ll be fine
3
224
1
3,379
42,075
Re-upping!!!
All of the handwringing over RCV and Dan Sullivans here will seem so silly when Peltola clears 50% in the first round.
2
56
Logan retweeted
It really does matter what election you're comparing results to. Voters can move a lot!
1
3
73
Logan retweeted
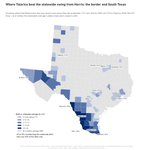
The first map are the counties that shifted more than the statewide average from Harris in 2024. The 2nd map are the counties that shifted more than the statewide average from 2018. Talarico perfectly thread the needle to win. Remarkable
1
52
The first map are the counties that shifted more than the statewide average from Harris in 2024. The 2nd map are the counties that shifted more than the statewide average from 2018. Talarico perfectly thread the needle to win. Remarkable
1
52
It really does matter what election you're comparing results to. Voters can move a lot!
1
3
73
We've probably spent too much time looking at Talarico's over-performance of Harris, and not enough time looking at his over-performance of Beto. The suburbs JUMP off the map.
1
2
1
348
When you write a path to victory for a reach district, you often have to say things like, "If you can get Clinton level support with Latino voters, Biden-level support with White college ed voters, and Obama level-support with black voters, you can win". Rarely does it happen!
20
I was not a believer in the South Carolina Senate race, because I underestimated the potential of South Carolina's suburban white voters to move our way.
1
1
37
I was very clearly wrong, and while it was a wave year, there really is potential for Dems to compete in SC, even if we'll be underdogs in every race.
1
1
15
And just another way to show the vote shift among white voters in SC
8
Logan retweeted
a democratic turnout advantage you can see from space
19
108
39
894
175,484
If you only count the votes in the 3 CDs that make up ~50% of the state's square mileage they're right!
ILGOP loves to be like "we won if you ignore Chicago and the collar counties and East St. Louis area and Champaign-Urbana and Springfield and Peoria and the Quad Cities"
84
Logan retweeted
This is what you would call a wave
1
51
I'm often pretty skeptical of exit polls and election-night takes, because there's often a lot more nuance in the results than what you get on election night, but the exit polls seem like they're pretty good. Here's a quick thread.
1
1
1
5
345
The rural shifts are still pretty big!
1
1
22
This is what you would call a wave
1
51