Misty_πŸ’› (@_Mistyyyy__) header
Misty_πŸ’› (@_Mistyyyy__) profile picture

Documenting my data analysis journey hereπŸ“Š Status:Not a NewbieπŸ™‚β€β†”οΈ

Joined January 2025
Photo by Misty_πŸ’› (@_Mistyyyy__)Photo by Misty_πŸ’› (@_Mistyyyy__)Photo by Misty_πŸ’› (@_Mistyyyy__)Photo by Misty_πŸ’› (@_Mistyyyy__)Photo by Misty_πŸ’› (@_Mistyyyy__)Photo by Misty_πŸ’› (@_Mistyyyy__)Photo by Misty_πŸ’› (@_Mistyyyy__)Photo by Misty_πŸ’› (@_Mistyyyy__)Photo by Misty_πŸ’› (@_Mistyyyy__)Photo by Misty_πŸ’› (@_Mistyyyy__)
I just completed a powerbi fintech dashboard project. I worked with a synthetic dataset from kaggle an I built a 2- pages interactive report analyzing customer behavior, account activity, and loan performance. I handled the data cleaning using powerquery
30
38
1
351
17,485
Misty_πŸ’› retweeted
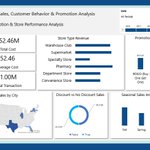
I just wrapped up a new project: Retail Sales, Customer Behavior & Promotion Analysis This one dives into how retailers can boost revenue & optimize promotions by understanding customers, stores, and seasonal sales trends.
2
2
2
376
I just wrapped up a new project: Retail Sales, Customer Behavior & Promotion Analysis This one dives into how retailers can boost revenue & optimize promotions by understanding customers, stores, and seasonal sales trends.
2
2
2
376
What excites me most about this project is how it connects data to real business value: βœ”οΈ Customer behavior insights βœ”οΈ Promotion effectiveness βœ”οΈ Store & seasonal performance Not just dashboards but actionable strategies. πŸš€
42
πŸ‘¨β€πŸ³
1
1
419
Misty_πŸ’› retweeted
Hiring isn’t just β€œapply β†’ interview β†’ hired.” It’s a pipeline full of bottlenecks, mismatched expectations & hidden patterns. I built a Recruitment Pipeline Dashboard (Excel + Power Query + DAX) to help HR teams see: βœ” Who’s in the talent pool βœ” Where candidates get stuck
8
17
1
138
7,389
Hiring isn’t just β€œapply β†’ interview β†’ hired.” It’s a pipeline full of bottlenecks, mismatched expectations & hidden patterns. I built a Recruitment Pipeline Dashboard (Excel + Power Query + DAX) to help HR teams see: βœ” Who’s in the talent pool βœ” Where candidates get stuck
8
17
1
138
7,389
βœ” How sourcing & salary align The takeaway? Recruitment data isn’t about counting applications. it’s about finding the story: Why some roles attract interest but don’t convert Why certain experience groups move faster Why strong hires sometimes come from unexpected places
2
260
Misty_πŸ’› retweeted
How do you handle the data modeling btwn a fact table with two important dates and the date table? That was my challenge for this analysis but I was able to overcome it through the active and inactive relationships and DAX's 'USERRELATIONSHIP()' function to activate the inactive
7
7
89
3,498
How do you handle the data modeling btwn a fact table with two important dates and the date table? That was my challenge for this analysis but I was able to overcome it through the active and inactive relationships and DAX's 'USERRELATIONSHIP()' function to activate the inactive
7
7
89
3,498
Also, the Lead Status column had Converted and Retained leads. Many would only count Converted, but Retained also meant repeat customers critical for accurate conversion analysis. This project stretched my skills, but i pushed past these hurdles, uncovered patterns and insights
2
229
Here's the final report. This report is to help stakeholders drive data informed devision that enhances profitability, improves customer engagement, and supports strategic business growth. To avoid many charts,I used field parameters to show & hide categories
Wireframing before visualization has been a game charger, and I don't use a fancy tool for it, just PowerPoint! Planning my layout first makes the process smoother, faster, and less frustrating compared to the struggle with layout and backgrounds when...
3
8
78
4,896
Why is there blue in my pie chart?πŸ˜‚πŸ˜‚ I'm just seeing it
1
210
Misty_πŸ’› retweeted
Wireframing before visualization has been a game charger, and I don't use a fancy tool for it, just PowerPoint! Planning my layout first makes the process smoother, faster, and less frustrating compared to the struggle with layout and backgrounds when...
10
13
1
121
11,581
Wireframing before visualization has been a game charger, and I don't use a fancy tool for it, just PowerPoint! Planning my layout first makes the process smoother, faster, and less frustrating compared to the struggle with layout and backgrounds when...
10
13
1
121
11,581
building dashboards directly in Excel or Power BI, especially using shapes and trying to make everything. If you're learning like me, wireframing before you build might save you a lot of time. 😊
1
4
491
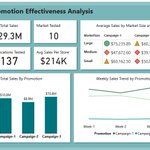
A fast-food chain plans to add a new item to its menu. However, they are still undecided between three possible marketing campaigns for promoting the new product. In order to determine which promotion has the greatest effect on sales...
2
15
290
the new item is introduced at locations in several randomly selected markets. A different promotion is used at each location, and the weekly sales of the new item are recorded for the first four weeks...
1
141
I used Power BI to analyze this A/B test and help decide: ➑️ Which campaign drives the most sales? ➑️ How did results vary by market size or store age? Built a clean dashboard + clear insights for decision-makers.
136
Imagine managing a loan application system with loan status changing from approved rejected, in review to active every now and then. Instead of repeating the UPDATE queries everytime. Stored procedures handles it all with one call. New update? Just exec with the current variable
1
15
620
Just finished a two-pages interactive excel dashboard on customer behavior and revenue trends from a retail dataset .Data cleaning inpowequery. This analysis focused on who is shopping, how often and what they're buying.And where money is coming from and what's driving it
13
22
189
7,283