

Professor (Associate). Department of #Plant_Ecology and #Botany at UCD | PhD in #Environmental_Sustainability & #Natural #Resources | He/ his
Joined August 2011
- Tweets274
- Following764
- Followers274
- Likes799




Pinned Tweet
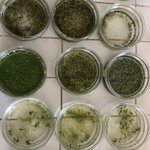
Thrilled to share my latest article on the enchanting world of #LemnaMinuta! 🌿 We dived deep into its natural habitat in Morocco & explored the impact of various synthetic growth media on its morphology, biochemistry & proliferation. doi.org/10.1186/s12870-023-0… #BMCPlantBiology

575
Happy to share with you my new article :
Delving into the determinants of #plant community patterns in #Rivers — A case #study of #Hydrological #Basin of Sebou (HBS)
doi.org/10.1002/eco.2651
146
Excited to share my latest publication as a coauthor on "Effects of Temperature, pH, and Salinity on Seed Germination of Acinos alpinus subsp. Meridionalis and FTIR Analysis of Molecular Composition Changes". Check out :
mdpi.com/2182220 #mdpisustainability via @Sus_MDPI

1
352
I'm pleased to share with you our new article: Chemical composition, antioxidant/antibacterial activities and ADMET study of the essential oil isolated from the aerial parts of Ziziphora hispanica grown in Morocco tandfonline.com/doi/full/10.…

330
Pr. A Maissour 𝕏 retweeted

Reviewing a paper that uses a shapiro-wilk test to see if their response variable is normally distributed before using linear regression. This is not necessary! Linear regression does not assume a normally distributed response, it's the residuals that are normally distributed.

ALT set.seed(3) n <- 500 # create covariate covariate <- runif(n, -10, 10) # generate response variable y <- rnorm(n, 1 + 2 * covariate, 5) # oh no, not normally distributed (p < 0.05)! shapiro.test(y) # Shapiro-Wilk normality test # # data: y # W = 0.98609, p-value = 0.0001039 # fit linear regession anyways m1 <- lm(y ~ covariate) # get model residuals, this is what we assume to be # normally distributed. m_resid <- resid(m1) # oh wow, normally distributed (p > 0.05)! shapiro.test(m_resid) # Shapiro-Wilk normality test # # data: m_resid # W = 0.99728, p-value = 0.5847
Pr. A Maissour 𝕏 retweeted

How to establish authorship contributions?
The CRediT (Contributor Roles Taxonomy) is increasingly asked for by journals at the submission process.
It can help you think about authorship contributions.
credit.niso.org/

I'm pleased to share with you our new article: Biological control of major postharvest fungal diseases of apple using two Lamiaceae extracts tandfonline.com/doi/full/10.…

155
Pr. A Maissour 𝕏 retweeted

📢 URGENT!!! We are still looking for a Master student to work on forest ecology, microclimate and conservation.
6 month internship located in Toulouse at @EDB_Lab and supervised by me and @JMSerraDiaz.
Expected start: February or March 2023
Please RT!

Pr. A Maissour 𝕏 retweeted

BioNumPy: Fast and easy analysis of biological data with Python biorxiv.org/content/10.1101/…

Pr. A Maissour 𝕏 retweeted

Remember this figure? A number of people were interested in how it was made, so here’s a how-to🧵 (1/15)
Assuming basic grasp of #RStats & Illustrator or Affinity Designer
Let me know if you need something clarified, haven't made one of these before. 😁
academic.oup.com/iob/advance…

Pr. A Maissour 𝕏 retweeted

Fun fact: If holly (Ilex aquifolium) finds its leaves are being nibbled, it switches genes on to make them spiky when they regrow. So on taller holly trees, the upper leaves (out of reach) have smooth edges, while lower leaves are prickly. Cool info from u/dirtybird971 on Reddit

Pr. A Maissour 𝕏 retweeted

Wow. Look at this great use of #Rstats #phytools plotting functions contMap & phenogram in this recent @eLife paper by @EcologicalTom et al.
"Latent functional diversity may accelerate microbial community responses to temperature fluctuations." doi.org/10.7554/eLife.80867

Pr. A Maissour 𝕏 retweeted

Linear Discriminant Analysis in R
Linear Discriminant Analysis in R, finnstats.com/index.php/2021… #programming #statistics #datascience #rstudio #rstats


Pr. A Maissour 𝕏 retweeted

Here’s what happens to regression when sample sizes are low—even with a strong underlying correlation, sampling error will erode everything
New update to the {switchboard} #RStats package for simulation visualizations coming soon!
See YouTube for more:
youtu.be/Zj3MBV4f_PE – at Tampa, FL
Pr. A Maissour 𝕏 retweeted

Early-career faculty: do yourself a favor and download our huge (updated) database of funding opportunities with have your name on it.
We list 572 (!) funding opportunities, along with description, deadline, amount, eligibility, etc.
Download here: research.jhu.edu/rdt/funding…

Pr. A Maissour 𝕏 retweeted

Excited to share our new paper about competition for light available at nature.com/articles/s41586-0…! @stan_harpole, Yann Hautier, Risto Virtanen, Mia Jessen. Thank you all wonderful people who established and maintain GCEF @UFZ_GCEF! @Martin_Schadler
Pr. A Maissour 𝕏 retweeted

“Towards a unified theory of plant photosynthesis and hydraulics”.
Our new theory of #photosynthesis is now out in Nature Plants!
The paper is open access, so do have a look!
doi.org/10.1038/s41477-022-0…
Link to a blog article in the next tweet.


Pr. A Maissour 𝕏 retweeted

Advance Access🚅: Letter to the Editor
Accurate Direct PCR With Arabidopsis and Rice
doi.org/10.1093/pcp/pcac145
Peter G Lynagh et al.💐
@WataruSakamoto3 tested this method and works very well for genotyping👍
