

AMS is a professional organization that advances the atmospheric and related oceanic and hydrologic sciences in service to society.
- Tweets21.5K
- Following434
- Followers41.2K
- Likes15.4K








ALT 2025 AMS Senior Named Scholarship recipient Sadie Morris with AMS past president Dave Stensrud and Todd Glickman, sponsor of the scholarship.


ALT This image is a promotional graphic for the 107th Annual Meeting of the American Meteorological Society, which will be held in Denver, CO, from January 10-14, 2027. It invites sponsors to "Step into the Spotlight in Denver" and highlights opportunities like the "Presidential Forum" and a "Social Media Wall." On the left, there's a diagram related to flood classification, and the bottom right features the hashtag #AMS2027.

ALT The image is a promotional banner for an upcoming American Meteorological Society webinar titled "Engaging Communities," scheduled for November 3, 2026, at 2:00 PM Eastern Time. It features headshots of two moderators and three panelists from various universities and organizations, including Northwestern University, University of Maryland, University of Arizona, and NOAA Weather Program Office.



ALT GOES-16 visible images of multiband cloud features in the low pressure system for a 1-h period on February 1, 2020 at (a) 1440, (b) 1510, (c) 1525, and (d) 1540 UTC. The multibands can be seen as striations in the cloud reflectance most notably along the 45° azimuth, but also along the 90°–100° azimuth range in all four panels. As time progresses, the striations in the cloud reflectance become more well-defined with an apparent regular oscillation. At 1540 UTC, panel (d), the bands essentially cover the full northeast sector of the storm from ~15° to 115° and near the storm center out to at least a 250-km radius. The data are shown on a storm-centered polar grid with range rings starting at 50 km and ending at 300 km. Note that 0° is pointing to the east. The red line marks the approximate track of the ER-2 aircraft during the 1429–1449 UTC time period. See separately the animation of the GOES-16 satellite imagery for the same time period at the beginning of this article highlight.


ALT Visualization of the Suomi NPP in orbit with Earth in the background. (Credit: NOAA)


ALT Graphic for the 107th Annual Meeting of the American Meteorological Society Presidential Session titled "What Hurricanes Irma and Maria Taught Us About Grassroots Preparedness," will be held on Tuesday, January 12, 2027, at 1:45 PM to 3:00 PM MT. The moderator is named as Travis Washington from the Department of Interior Marine Minerals Administration. Panelists include Ernesto Rodriguez from the National Weather Service, San Juan, Puerto Rico, and Chip Kasper from the National Weather Service, Key West, Florida.

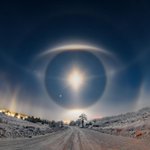
ALT 2026 AMS Photo Contest 1st place winner "Diamond dust sky eye" by Jaroslav Fous.

ALT 2026 AMS Photo Contest 2nd place winner "Sea Dragon" by Chris Elkinton.

ALT 2026 AMS Photo Contest 3rd place winner "Cirrus, the Veils of the Moon" by Roberto Bueno.

ALT 2026 AMS Photo Contest Member's Choice winner "Rainbow Cataclysm" by Jeremy Janus.


ALT Aerial photo of the Eaton Fire on the slopes of Mount Wilson, January 8, 2025. USDA Forest Service photo by Matt Muller, HLCO 509. Source: Wikimedia Commons.


ALT Graphic promoting the "Social Media Toolkit" for the 107th AMS Annual Meeting.
ALT Graphic promoting the "Social Media Toolkit" for the 107th AMS Annual Meeting.

ALT A photo of Jose D. Fuentes.

ALT In this webinar, guest speaker Elizabeth Meister talks about careers in emergency management.

ALT A screenshot of a map of the contiguous United States displaying varying climate zones, with colors indicating temperature and precipitation patterns. Warmer colors cover the Southwest, while cooler colors appear in the Northeast and Northwest. Major cities such as Los Angeles, Chicago, and New York are marked. Photo credit: NSF NCAR.


ALT In this webinar, guest speaker Daja Elum talks about careers in environmental science.