




Amanda retweeted

In the past week:
All flights were grounded in the U.S.
Service outages at major banks
Outlook email crashed
The NSA’s classified communications network is down
And President Trump? He's announcing new renovations to the White House!
30 days of Ladder Pro for free if anyone wants to give it a try! Sharing my guest pass link below. I believe the offer expires tonight!
joinladder.com/referral?utm_…

259

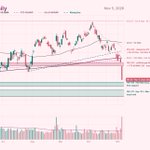
$SPY Last week I said 729–732 was the area to watch after that ugly candle, and so far it’s held. It bounced about 3% off the lows and finished the week around 754, which is a good reaction.
Still, there’s work to do. For me the line is the 50-day near 764, because getting back above it would put the October closing high at 779 back in play. Until then, it’s better to treat this as a bounce rather than a full recovery.
If we lose the Nov 5 low around 733, the 200-day just under it at 732 is the last real floor before this turns into something bigger, and 716–723 is the next area I’d watch.
This week $NVDA reports Tuesday night, Fed minutes come out Wednesday, and the Anthropic IPO is expected to start trading Thursday, so I’m keeping my size small and waiting to see how the market digests all three before I lean one way or another.


$SPY That's a pretty ugly candle. Four rejections around 775–779, followed by a sharp selloff that took out both the 10-week and 50-day.
733 is where we closed, with 729–732 immediately below. That's an important confluence of support, including the 40-week SMA and July low. If we lose that, 716–723 is the next area I'm watching.
Not a great look, but we're approaching an important support zone. Let's see if buyers show up. First step is getting back above 763–767.

3
228
Semis are looking a little rough heading into next week. Both $SMH and $SOXX (semiconductor ETFs) dropped below their lower weekly Bollinger Bands, but are now attempting to move back inside. Encouraging to see buyers step in after the selloff.
Obviously, $NVDA earnings on Tuesday are going to be a big one, and also everything else surrounding Jensen right now.
I'll be watching to see if both ETFs can hold back inside their lower bands and build on Friday's bounce, or if they slip right back below. That should give us a better idea of whether this was just a temporary relief bounce or something more.

2
469
The Nasdaq is still looking pretty weak compared to the S&P, but there are a few things worth watching.
It's now 8.9% below its Oct 6 high, versus 6% when I last posted this chart. It's also slipped below its 200-day, and the 50-day is still a good distance away.
The one thing that's improved is the breadth line. It finally turned up from its October lows and moved back above its 10-day average, which is what I wanted to see last time.
Still, we're not out of the woods. Only 38% of Nasdaq stocks advanced on Friday, and the McClellan Oscillator is still negative at -7.
So, some improvement, but not exactly a reason to get excited just yet.
I want to see that breadth line keep moving up and more stocks start participating. If it rolls over and makes another low, I'd take that as another sign that the Nasdaq is going to keep struggling.
For now, it's a step in the right direction, but I'd like to see a lot more follow-through.

Same week, but the Nasdaq looks a lot weaker underneath than the S&P 500 does. It's about 6% below its Oct 6 high, and the breadth line on the chart is sitting near its lows and hasn't turned up yet.
The selling has slowed down, with 40% of Nasdaq stocks rising on Friday versus 27% the Friday before, but a slower decline is still a decline.
I want to see that line turn back up. If the next selloff pushes it to new lows, I'd expect the Nasdaq to keep lagging the rest of the market.

2
321
Since my last update, breadth has improved considerably, even as $SPY has struggled to make progress.
Since my post from October, $SPY dropped from 759.97 to 754.37 and remains below its 50-day at 764.43, but underneath, participation has actually improved. The percentage of S&P 500 stocks above their 50-day has climbed from 58% to 71%, while the 200-day reading has moved up from 56% to nearly 64%.
The 20-day reading dipped a little, from 69.8% to 67%, but that's a pretty small pullback considering how much better breadth looks overall.
That matters because it isn’t just a short-term bounce, with more S&P 500 stocks now above their medium and long-term averages too, so the strength has spread well beyond a few names.
I’d like to see $SPY reclaim its 50-day while the share of stocks above their 50-day holds above 60-65%, because that’s what would turn this from a healthy-looking market underneath into a real recovery on top.
For now the average stock looks better than the index, and price still has to confirm it by getting back over 764.

Last week I said I wanted AI and chips to settle down before I trusted a push through $SPY's 50-day, and the week went about how you'd expect, with $SPY closing above it Tuesday and Wednesday and then giving it back Thursday when the Nasdaq sold off 2.6%
The somewhat encouraging part is that breadth kept improving through all of it. Thursday more S&P 500 stocks were actually above their 50-day than the day before, and the week ended with 58% of them there versus 45% the week before.
So the question now is whether the rest of the market can keep holding up while the AI names drag, and I think it can as long as that 50-day reading stays above 50% and $SPY gets back over 767.81, but if the reading slips under 50% while $SPY stays below that line, I'd call this a bounce that failed, with the 200-day at 727 (about 4% lower) as the next level that matters.

1
1
307
Apparently, enjoying the privileges of living in America and caring about the suffering of people elsewhere are mutually exclusive. Strange way to understand the world.

At dinner in SoHo and I overhear a group of people and their hatred for America.
And I think to myself.
1) If you hate it here so much, why did you move here?
2) If all you care about is Free Palestine, move to Palestine and liberate it.
Rather, you’re sitting in NYC at an upscale Italian restaurant in SoHo drinking $200 wine and munching on an Octopus tail, rack of lamb, and having prosciutto toast.
Stfu you whiny morons.
1
1
437


Amanda retweeted

I'm gonna be real honest. I'm an ELDER MILLENNIAL and I don't have children and it's spectacular.

Me: Ooh this stock is down 40%. Looks cheap.
@RealSimpleAriel’s voice somewhere in the back of my head: “It’s below the 200 MA. Why would you buy it here?”
Probably saved me more times than he’ll ever know.


$SPY That's a pretty ugly candle. Four rejections around 775–779, followed by a sharp selloff that took out both the 10-week and 50-day.
733 is where we closed, with 729–732 immediately below. That's an important confluence of support, including the 40-week SMA and July low. If we lose that, 716–723 is the next area I'm watching.
Not a great look, but we're approaching an important support zone. Let's see if buyers show up. First step is getting back above 763–767.
Women are the soul of a nation. They are its conscience, its memory, and its possibility.
As Bernice King reminds us, women must be part of the conscious decisions that shape and govern our lives.
Seventeen women will soon serve as governors, a record. Barriers once thought immovable have fallen. A Black woman will lead Georgia. A Native American woman will lead New Mexico. A Latina will lead Texas. Think about the generations of girls who will grow up seeing these women in positions of power and knowing that those possibilities belong to them, too.
There is something incredibly exciting about witnessing this shift. Representation means seeing more of ourselves reflected in the people shaping our future, and realizing that we, too, have a hand in building it.
For too long, women’s voices waited at the edge of the table. Now, they’re taking their seats, and I couldn’t be happier to see it.
Matriarchy is rising. This is only the beginning. 🌹
forbes.com/sites/kimelsesser…

306
$QQQ daily, and the shelf did not hold. Price fell 6.5% today and closed at $647, right on the lows, after losing every level I had marked on the way down. I had this exact path written out last time and the levels were right, but I’m a lot better at marking my downside levels than I am at trading them. 🥲
The first support is around $637–644, and bulls need to get back above $661 before this looks like anything other than a downtrend.

$QQQ (Nasdaq 100 ETF) daily.
Down about 7% from the $763 ATH. Friday closed at $709.80 (heaviest volume since June).
That’s the 4th test of the $700–707 shelf since August. If we lose it, $682 is next, then $661. That’s the Jul 29 low, the YTD AVWAP and the 50-week SMA all in one spot.
Bulls need $719–727 back. That’s the 50-day SMA and the Jul 29 AVWAP.
For a long, I’d like to see a higher low form, then a retest. SL below $696, first target $748.
If the shelf breaks, I’d watch $682 for a potential bounce and look for a reclaim of $700 before considering a long. SL below $681.

1
415
$NVDA The weekly trendline I flagged earlier gave way and the stock gapped straight through the 200 SMA without stopping, closing at $181.60 on heavy volume.
That gap is now open overhead and sits right under the 200 SMA at $204.7 and the YTD AVWAP at $201. Bulls need to reclaim that before anything else matters. First support is the $175–179 area, and below that the $164–171. A close under $164 would break the lows of the whole uptrend. Best to wait for price to reclaim.

$NVDA sitting right on support. Zoom out to the weekly and the April 2025 low, the July 2026 low, and today’s low all sit on almost the exact same rising trendline.
Range’s been narrowing though, resistance climbing slower than support since last year, so this is more a tightening wedge inside the uptrend than a clean channel. Still constructive, just worth knowing.
Not a bad spot to add here with a tight stop below 200.

2
440
$NBIS update: I’d really like to own this one and I’m watching it closely.
The breakout failed, and price slipped under the July 29 low at $145.80 before gapping down 15% today to close at $120.37 on heavy volume.
It’s now sitting right on the March lows at $112–113. If it breaks, we're looking t $107.50–110 next and then $89.65.
Before I get in, I want to see $112–113 hold and the hourly make a higher low, since I don’t like buying the first touch of a level.
Bulls need to reclaim $134.80–141 first, which is today’s gap plus the Oct 2025 high, and then $145.80 and $160–164 after that. The big one is $178–183, where the 200 SMA, the YTD AVWAP, and the Aug 7 low all meet, and until price gets back above it the trend is down.
Earnings on Nov 12.

$NBIS daily.
The breakout failed. Price lost the rising trendline, the $195–204 shelf, and now the $160–164 support zone. Closed at $159.17.
Next level: $145.80, the July 29 low. That needs to hold.
Bulls need to reclaim $180.60 first, then $195–204 and $217. Until then, the trend is down. Don’t fight the chart.

2
534
$W (Wayfair) weekly.
I'm watching this one. Pretty aggressive rejection from the breakout zone I was looking at yesterday. Gapped up to $128 on Wednesday's earnings, only to give most of it back today. Now sitting inside the gap around $112.
Not entirely surprising given the broader market weakness, but not the follow-through I wanted to see.
I don't mind this level as long as it holds. A higher low here and a reclaim of $116–118 is what I'd like to see next.
$111.32 is the downside level I'm watching. Below that, trendline/50-day SMA support comes in around $106.
Still like the bigger picture. Reclaim $128 and there's room toward $137, then $160. Not much resistance above that until the old 2021 range

1
355