

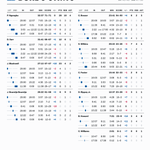

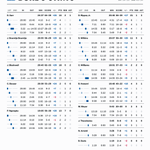


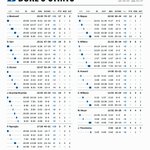
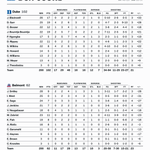



Great follow up to my crashing tweet earlier. Always love what @CrumpledJumper puts out. A must-follow (if you somehow only follow me and not him??)


The most common risk-averse decision in college basketball is sitting a starter with two first-half fouls. The risk coaches are protecting against is smaller than it looks.
Coaches don’t agree on this one. Per KenPom, last year Pitino let two-foul starters play 1.9% of remaining first-half minutes. Izzo 7.1%, Sampson 8.4%. Golden 58.6%, Scott Drew 49.2%. D-I average was 25%.
Start with what sitting actually costs. Compare a player to himself in his other games at the same point of the half, and a second foul costs him about 3 minutes of that half and 3.5 minutes of the game.
The reason you eat that cost is you’re scared he fouls out. But players with two fouls foul 25% less often than they normally do. Some of that is them being careful, but either way he’s less likely to foul out than you’d think.
Take a typical starter with two fouls and 10 minutes left in the half. Leave him in and he fouls out about 1 in 4 times. Sit him until halftime and that drops to 1 in 7, but he plays about 7 fewer minutes the rest of the game to get there.
The next argument is that he’s playing scared and isn’t worth much out there anyway. He does play more carefully, Ken showed that back in 2016. But his on/off barely moves when he’s playing on two fouls, about half a point per 100 possessions. That’s not enough to justify sitting him.
The obvious objection is that you’re saving him for crunch time, and crunch time minutes matter more. They do, and I weighted them that way. Leaving him in still comes out ahead in every situation I tested. And you still have to get to crunch time with the game close enough to matter.
Then there’s depth. A good sixth man doesn’t make sitting the right call, it just makes the whole decision matter less. The gap between your starter and his backup is what’s at stake either way. Small gap, small stakes. Big gap, sitting him costs you a lot. The answer is play him in both cases.
The one thing the data can’t see is the matchup. If he’s picking up fouls because of who he’s guarding, the coach knows that and the data doesn't!
The edge per decision isn’t huge, about half a point of win probability, more if your bench is thin. But it’s free. There’s no version of this where sitting him is the better bet, so every time a coach does it, he’s paying a little for insurance he doesn’t really need. The main reason this happens is that it looks safe. If you leave him in and he fouls out with eight minutes to go, you look bad.
It is changing, though! When Ken introduced the stat in 2018, he noted it had been falling since 2010. It’s reversed since. League-wide 2-Foul Participation was 25.4% last year, the highest in the 17 seasons he’s tracked it. Something I’ll be paying close attention to this season.
(This is from seven seasons of lineup-level play-by-play through last season. About 132,000 second first-half fouls, 2.9 million player stints, 5 million possessions.)
This is really good stuff! There are numbers that support the idea of just crashing everyone possible. The gained likelihood of an offensive rebound with extra crashers, over time, negates any impact on your transition defense. Your efficiency scales with more crashers.
And it’s possible to “stop ball” by crowding the rebounder with bodies too + you can immediately set a high pick-up point. Smart that they track where those misses land.
Just crash ‘em all. Send it.

Little basketball analytics rant.
I’ve been seeing more and more people on my timeline use points-per-possession (“PPP”) when talking about actions (and even shooting?). Maybe my timeline has just gotten more college basketball-heavy, but PPP has quietly become a catch-all stat, and it’s getting stretched way past what it measures.
PPP is a team efficiency number. It’s great for game- or season-long efficiency, and it’s usually what you’re seeing reported as offensive/defensive rating.
When we’re measuring action-level events (picks, drives, isolations, etc.), we want points-per-chance (“PPC”). A chance splits possessions into distinct scoring opportunities, broken up by offensive rebounds and dead balls.
Say you run a pindown and the pass gets deflected out of bounds. From the side-out, you run something else and score two. The pindown produced zero points, but PPP credits it with two because you scored on the same possession. PPC gives it zero.
If you want to be more precise, you can attribute putback points to the chance that created the miss. Then there’s the concept of direct chances (and true points/shot for shooting!), but this post is already long enough.
Posted and turned on football. Anyways, closing thoughts:
Location is a pretty blunt proxy. My data doesn’t capture most of what makes a shot "good" or "bad." Rhythm, balance, contest strength, and who’s shooting matter more than the spot. And not every three is a good three either!
There’s a place for the midrange. Some guys are really good at it. Some defenses take away the rim/three and you need a counter. A good shot for one guy is a bad shot for another.
That’s where coaching comes in. Know your personnel, get buy-in, and build the right habits in practice.
But all things considered, the midrange usually isn’t an efficient look. Especially in college, where there’s no defensive three seconds and most guys just aren’t good enough shot creators to live there.
Shot diets built around the rim and catch-and-shoot threes (paint-kicks, perimeter-swings, etc) win long term.
(I paid Elon $4 to write a longer post, smh)

The average midrange shot in college is worth a 28% three.
Long twos (15+ ft) sit at 26%, draw the fewest shooting fouls of any two (4%), and have the lowest OREB% of any shot (25%).
There's a time and place, but relying on the midrange is minus-EV long term 👇


group chat reignited two age-old debates:
a) can one all-nba player make the worst-rated kenpom team a national title contender?
b) who is the worst nba player who would make a 16-seed even money to reach the final four?


Over 200,000 D-I vs. D-I games in the 64-team era have produced 3,748 different final scores.
Only 15 were new ("a scorigami") in 2025–26, and Georgia and Ohio State had two each. Most were 40-point blowouts, and there were none after Dec. 20.
👇👇👇

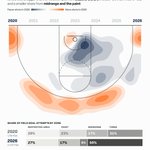
Over the last seven seasons, Illinois has cut its midrange share by nearly two-thirds. The Illini went from 69th to 7th among high-majors in three-point share.
Great teams are chasing high-value shots 👇

Willing to make these for some different teams. If you want to see one for yours, comment below 👇
