

Advancing scientific excellence by publishing influential results in fundamental, applied, and interdisciplinary physics across @apsphysics' journals.
- Tweets413
- Following5
- Followers1.2K
- Likes73




ALT Colorful circular pattern with the text "APS Open Science APCs Waived" in the center.

ALT A figure shows a multicore ellipsoidal particle. In the figure, a lightly shaded elongated oval is filled with smaller grey shaded circles each containing a blue arrow and a green two-headed arrow pointed in different directions. The blue arrows indicate magnetic moment and the green represent the corresponding magnetic anisotropy axes. One of each type of arrow is circled in red and labeled in its arrow’s color. The circles are layered, making it difficult to pick out each one individually.

ALT Diagram showing the crystal structure of Li6.5La3Zr1.5Ta0.5O12 (LLZTO) with a garnet framework, showing Li+ ions occupying tetrahedral and octahedral sites. LaO8 polyhedra are labeled and shown in red, mixed with (Zr,Ta)O6 polyhedra shown in blue. Lithium ions are labeled. Oxygen is shown as small red spheres. Axes are shown on the bottom left of the diagram.

ALT Two graphs of the 3D trajectories of a 7.17 µm particle and several surrounding 10.41 µm particles within a complex plasma structure over a period of 8.1 s. The top graph shows the axonometry of trajectories and the bottom graph shows a top view of the trajectories. The structure is suspended in a sheath of argon rf plasma at 3 Pa. The coordinates reconstructed from the 2D particle images recorded at 90 fps from 4 different angles. The color encodes a vertical z-displacement of the microparticles relative to the plane of the 10.41 µm microparticle layer.

ALT Curved golden light trails against a dark background, creating a dynamic, flowing effect resembling motion or speed.

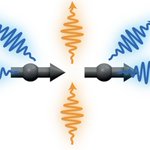
ALT A schematic illustrating a side view of photons traveling among the quantum emitter array. Orange curved lines represent photons emitted at ωL and kL,∥∥ , while blue curved lines represent photons emitted at other frequencies and wavevectors. Black circles and arrows denote individual quantum emitters.

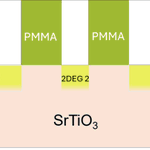
ALT 2D surface electron gasses, represented by yellow rectangles, are formed on the surface of a strontium titanate substrate under metalling bonding pads represented by gray rectangles and next to side gate contacts represented by green rectangles.

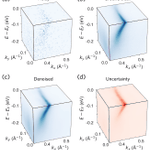
ALT A set of cubes show probabilistic denoising of three-dimensional angle-resolved photoemission spectroscopy data. The top left shows the noisy input data. A smattering of blue dots fills a light blue box, with a cluster making a sideways V-shaped mark at the top. The top right box shows the ground truth data, which appears similar to the noisy data but more filled in and with a more prominent V mark in dark blue. The bottom left data shows the denoised output, which looks similar to the ground truth data. At the bottom right, a cube shows the uncertainty map which looks similar to the denoised cube, but the data points are orange and the cube is shaded light orange.

ALT Visualization of the Ising model from Curato, et al. A graph divided in half with a gray and blue right side. A Legend on the right side denotes the values for each blue square.

ALT Abstract digital image featuring overlapping semi-circular shapes in red and green, intersected by a central purple arrow.

ALT A diagram showing the adaptation of OmniLearned, a model trained on particle collisions, into OmniCosmos for cosmology. Both models combine feature and local embedding and pass them through transformer blocks. OmniLearned performs jet classification and generation while OmniCosmos predicts velocities and parameter regression. In OmniCosmos, green shading indicates a high learning rate for the input and output layers, while gray indicates a low learning rate for the transformer blocks.

ALT Three cube-shaped simulated networks of crisscrossing fibers, connected by two blue arrows. The cubes show cyan patches in each vertex. A "Disruption" arrow points from the top-right cube to the left cube. A second arrow, labeled "4.4τᵥ," points from the left cube to the bottom-right cube. The fibers in the cubes are colored by tension, from pale yellow to black.

ALT This figure shows the experimental setup of the atomic beam machine used to produce the dysprosium atoms. At left, a series of grey cylinders show a pulsed valve and a dysprosium rod, ablated by a laser source just above. At an indicated distance of six centimeters, a skimmer leads to a compact interaction chamber where the atomic beam passes through brown bars showing bias coils as well as grey microwave horns. On top, a second, alternate set up shows high voltage electrodes that expose the atomic beam to electric fields. To the right of the chamber, the beam ends in a grey sandwich of the detection chamber where two other lasers at 571 nanometers and 738 nanometers shine in. A vertical grey beam with arrows showing time of flight lead to a flattened disk of an ion-detector.

ALT An illustration of reduced stabilizer polytopes for two and three Pauli observables, showing how different commutation relationships and constraints produce distinct geometric shapes.

ALT This figure depicts a graph showing high-field magnetization of CrSb powder. Pulsed-field magnetization is shown with a black line for 2.1K, red line for 100K, and blue line for 255K, for magnetic fields up to 58T. The magnetization evolves smoothly with the magnetic field, with no signs of field-induced changes or transitions.

ALT A figure giving a pictorial overview of a framework for modeling matrix elements of local operators in chaotic quantum systems using structured random matrix ensembles.

ALT Two graphs stacked vertically. The first (a) shows hydrogen consumption profiles for ball-milled iron catalysts show strong peaks around 500–550°C, similar across the Mg, Ca, Sr and Ba supports, while free iron has broader high-temperature consumption. (B) Sol-gel catalysts show broader, higher-temperature hydrogen consumption, indicating that iron is less readily reduced than in the ball-milled catalysts.


ALT Simple Diagram labeled 'Machine Learning on Heterogeneous, Edge, and Quantum Hardware for Particle Physics' (ML-HEQUPP) indicating the areas of study. A large, open circle with two triangles inside - the yellow one is labeled 'physics' and the red one is labeled 'technology' Two arrows link the triangles, with the words 'co-' and 'design'. Starting at the top right of the circle is a beige section labeled 'Accelerators', followed by a yellow section labeled 'Neutrinos', then an orange section called 'AI/ML', then finally a dark orange section labeled 'Microelectronics'. Starting at the top left of the circle, a yellow section labeled ''Colliders', followed by a beige section labeled ' Dark Matter', then a red section called 'Quantum Algorithms & Devices, and finally, at the bottom, a pink section called 'Heterogeneous Architectures'.

ALT A figure of unit-cell representation of Ce2Te5 illustrating the two inequivalent Ce sites (Ce1 and Ce2) embedded within the Te framework. The structure consists of layers stacked along the b axis, with vdW gaps separating adjacent Ce-Te slabs. The crystallographic axes are indicated.