
Political scientist Sharing papers & findings here. For discussion, find me somewhere else.
- Tweets16
- Following14
- Followers0
- Likes4




ALT Our public data do not suggest that TikTok catalysed the violence. Help us learn more! A QR code links to tiktokforscience.org: share what you saw on TikTok by donating your watch history. Takes 5 minutes. Secured by the University of Zurich.


ALT Chart: Left and right are not talking about the same violence. For each outlet, the gap in percentage points between its share of videos on looting and its share on police violence. Outlets ordered from left-leaning to right-leaning audience: Le Media -33, Le Monde -15, Quotidien -5, Brut 0, BFMTV +4, TF1 Info +20, Le Figaro +27, CNews +24. Negative values mean more police violence, positive values more looting.

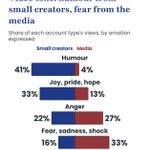
ALT Chart: Video tone, humour from small creators, fear from the media. Share of each account type's views by emotion expressed, small creators vs media: humour 41% vs 4%; joy, pride, hope 33% vs 13%; anger 22% vs 27%; fear, sadness, shock 16% vs 33%.

ALT Chart: On TikTok, violence is condemned ten times more often than it is celebrated. Out of 100 comments under videos showing violence, 21 condemn violence and 2 celebrate it; the remaining 77 take no position.

ALT Chart: Videos showing violence get fewer views for small creators, more for the media. Compared with the same account's other videos on the same day, a video showing violence gets 34% fewer views for small creators (violence costs views) and 40% more views for media outlets (violence brings in views).

ALT Chart: Images of violence come mainly from the media. Media produced 1.6% of all videos (small creators 87%, others 11%) and drew 19% of all views (small creators 48%, others 33%), but 56% of the views of videos showing violence (small creators 22%, others 22%).

ALT Chart: Protest demands drew twice as many views as violence. Out of 100 views related to the mobilisations, 14 went to videos showing violence (flame icons) and 32 to videos mentioning protest demands (placard icons).

ALT Chart: Calls to demonstrate circulate, but calls for violence are almost invisible. Out of 1,000 views related to the mobilisations, 10% go to calls to demonstrate and 0.1% to explicit calls for violence.

ALT Title card: Did TikTok fuel the violence during the French October 2026 demonstrations? Analysis based on 964,000 videos and 16 billion views. A line chart of daily views shows two peaks: 1.7 billion views on Oct. 1 (school blockades) and 2.2 billion views on Oct. 17 (demonstrations). Benjamin Guinaudeau, Isabelle Guinaudeau, Hugo Subtil. OBE Note no. 2026-21, CEPREMAP Well-Being Observatory, tiktokforscience.org.