

Helping business owners and managers make faster and more confident decisions. Data Analyst & AI Enthusiast | Excel · SQL · Power BI · Looker Studio · Python |
Joined March 2021
- Tweets708
- Following1.9K
- Followers529
- Likes419








ADEKING retweeted
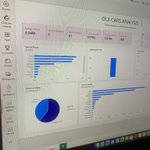
A higher price doesn't mean a fairer one.
Same make, model, year.. wildly different asking prices. Most buyers and sellers have no way to knw which one's fair.
Built a dashboard to find out what actually drives price, nd flag listings that are over or underpriced vs real comps.


ADEKING retweeted

There’s a weird stage in learning a skill where you know enough to follow tutorials but not enough to build something alone.That stage is frustrating.


ADEKING retweeted

I have over 400+ videos on Data Analytics - that's too many for one person to watch.
Here are the top 5 that I would watch:
1. How to Become a Data Analyst - youtube.com/watch?v=CUBfrdDw…
2. Complete FREE Data Analyst Bootcamp - youtube.com/watch?v=cnjhHZNJ…
3. Learn Power BI in Under 3 Hours - youtube.com/watch?v=I0vQ_VLZ…
4. Top 5 Reasons NOT to Become a Data Analyst - youtu.be/M2ySRYpo9S0
5. Learn SQL in 4 Hours - youtube.com/watch?v=OT1RErkf…
Some of these videos are ones I made over 5 years ago, but they still hold true today.


ADEKING retweeted
Learn DAX in Power Bi for beginners.
DAX stands for Data Analysis Expressions and it is a formula language to create calculations, Columns, tables, and measures.
Learn absolutely free at no cost💰💰
A thread 🧵👇
ADEKING retweeted
Which of the following function remove all data in a table in SQL?
REMOVE
TRUNCATE
WITH
ALTER

ADEKING retweeted
Losing your job does not mean losing your value.
You still have the same skills, the same experience, and the same worth as before.
Make sure you remember that when you're looking for your next job!


ADEKING retweeted
Early in my career, I worked on double blind studies and we relied heavily on patient surveys - but patients don't always respond.
So we would often sample data.
Sampling is the practice of analyzing a subset of your data to draw conclusions about the whole. And it works surprisingly well when done right.
Here's why sampling is useful:
1. Not everyone fills out a survey. Not every system logs every event. Sampling lets you work accurately with what you have instead of waiting on data that may never arrive.
2. A well-drawn sample accounts for gaps in your data so one missing group doesn't skew your entire analysis.
3. You don't need every data point to draw reliable conclusions. A properly selected sample can be just as accurate as the full dataset.
Of course, there's a lot that goes into sampling correctly so you don't get incorrect results!
I'm recording my full course on Statistics for Analyst Builder so statistics has been top of mind the past few weeks!
I'll also be creating a Statistics Series on YouTube after the PostgreSQL series :)
🤖 Made with AI


ADEKING retweeted
DAX is what separates Power BI users from Power BI developers.
Most people can drag fields onto a canvas and call it a dashboard.
But the moment someone asks for year-over-year growth, a running total, or a metric that respects filters the way the business actually thinks - you need DAX.
And the first real test is knowing when to use a calculated column vs a measure.
Get that wrong and your model bloats, your reports slow down, and your numbers stop making sense when someone clicks a slicer.
Get it right and you stop being the person who builds reports and you become the person who builds models other people build reports on.