danzn1 (@danzn1) header
danzn1 (@danzn1) profile picture

Python 🐍 Matplotlib Bender. highlight-text. plottable. ⚽- analytics and visualizations. VfL Bochum Stats @VfL_Stats 🧠Not very neurotypical 🌱Plant-Based

Germany, TiefImWesten
Joined August 2012
Photo by danzn1 (@danzn1)Photo by danzn1 (@danzn1)Photo by danzn1 (@danzn1)Photo by danzn1 (@danzn1)Photo by danzn1 (@danzn1)Photo by danzn1 (@danzn1)Photo by danzn1 (@danzn1)Photo by danzn1 (@danzn1)Photo by danzn1 (@danzn1)Photo by danzn1 (@danzn1)
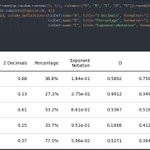
I published plottable to PyPI! 🎉 You can now make beautifully customized static tables such as this with @matplotlib. Have a look at the docs at plottable.readthedocs.io/en/… If you have suggestions & feedback, leave me a msg or file an issue on Github github.com/znstrider/plottab…!
10
78
14
491
Nuclear and modern renewable energy sources are both vastly safer and cleaner than fossil fuels. From the perspective of both human health and climate change, it matters less whether we transition to nuclear or renewables, and more that we stop relying on fossil fuels.
29
390
50
1,066
99,626
This week I went to the Opta forum. It was amazing and a bit scary how many people are using mplsoccer at clubs. One analyst asked how I designed it so a quick thread. 1/
6
25
12
186
60,199
Create a beautiful customized table using @matplotlib in python?⭐️💫 Why not?🤷🏽‍♀️ Who says the pretty tables can only be made in R😉 📍Visit my github profile to view code: github.com/fortune-uwha/Glob… #Python #dataanalytics #dataviz #R
5
12
1
64
7,855
𝗔𝘁 𝘁𝗶𝗺𝗲𝘀, 𝗶𝘁 𝗰𝗮𝗻 𝗯𝗲 𝗼𝗯𝘃𝗶𝗼𝘂𝘀 𝘄𝗵𝗲𝗻 𝘀𝗼𝗺𝗲𝗼𝗻𝗲 𝗶𝘀 𝘀𝘁𝗿𝘂𝗴𝗴𝗹𝗶𝗻𝗴 𝘁𝗼 𝗰𝗼𝗽𝗲, 𝗯𝘂𝘁 𝘀𝗼𝗺𝗲𝘁𝗶𝗺𝗲𝘀 𝘁𝗵𝗲 𝘀𝗶𝗴𝗻𝘀 𝗮𝗿𝗲 𝗵𝗮𝗿𝗱𝗲𝗿 𝘁𝗼 𝘀𝗽𝗼𝘁. Check in on those around you. #WorldMentalHealthDay | #YouAreNotAlone | @samaritans
4,911
111,316
33,907
295,692
66,236,081
"I think it's very worrying that we lock people up that are actually trying to make sure that we have some kind of future." - @GaryLineker 1/🧵 #ClimateCrisis #BiodiversityCrisis #EndFossilFuels
13
131
22
346
30,510
Leider sind sehr viele Menschen in unserer Gesellschaft von sich selbst, ihren Mitmenschen und der Umwelt sehr disconnected, was ihnen überhaupt erst ermöglicht, anderen und sich selbst zu schaden. Das ist ein großes gesellschaftliches Problem!
This Post is from an account that no longer exists. Learn more
1,152
Here’s the graphic with total race seconds over/under average total race second per compound instead, much better way to understand the data
1
1
2
1,057
Thanks so much for the inspiration @RobinRohwer I had fun creating my own version with @matplotlib
Mom asked, "I wonder when cherries bloom in Japan?" So I found 1200 years of data online and made her a plot.
6
1,793
danzn1 retweeted
#IPCC's Synthesis Report is out now! 👉 bit.ly/SRYRpt23 “Climate justice is crucial because those who have contributed least to #climatechange are being disproportionately affected,” said Aditi Mukherji, one of the 93 authors of the report. 🎥 youtu.be/bulhsb4IZFQ
37
201
13
297
40,854
🚨 New R package alert! 🚨 I’m over the moon to share that nwslR is back and better than before. The goal is to make #NWSL stats and information accessible to fans and analysts of the league. Check it out: github.com/nwslR/nwslR
13
102
26
538
181,365
It's #WorldThinkingDay & one thing we can't stop thinking about is #Aphantasia, the inability to visualise in your 'mind's eye'. After listening to @AdamRutherford @FryRsquared talk about Aphantasia, we've been asking everyone! Where do you place on the test? info @_aphantasia
32
24
17
96
36,211
Send me photos of your pets please I need a mood boost! – at Queens, NY
165
3
60
44,129
Love everything about this plot (but the shown reality).
NEW: This week's climate graphic looks at the historical emissions and current climate pledges of this year's COP28 host nation the UAE. Read @CamillaHodgson's excellent report ft.com/content/017eaeae-185d… #dataviz
3
944
"aLl xG mOdeLs ArE thE sAme" my brother in christ wut is this then
13
38
17
499
214,153
Anyone out there who struggles with @matplotlib - watch my 5min talk and stop struggling :) m.youtube.com/watch?v=vjQIae…
Hello, I've been using Matplotlib for 7+ years and I still google how to do everything except plt.plot()
4
1
25
11,090
"Research shows it costs taxpayers $31,065 a year to criminalize a single person experiencing homelessness while the yearly cost for providing supportive housing is $10,051." housingmatters.urban.org/fea…
354
13,900
891
44,067
2,919,911
„Es ist leider immer noch ein Tabu-Thema, dafür aber umso wichtiger, diese Probleme zu äußern.“ Niklas #Schmidt über seine mentalen Probleme und wie er damit umgeht 👉 svw.de/Schmidt040122 #werder
24
42
16
1,033
96,399
Sometimes I write up thoughts on thought provoking articles for myself to reason through it, here I did about @Jon_Mackenzie's article. Maybe some will find my perspective interesting.
Here's something I needed to get off my chest. I have some thoughts about the way that we talk about football tactics. I explain where I think we've gone wrong and where I think we need to go next. link.medium.com/vEPb6P0T6vb
1
2,207