
Director of Engineering and UX @grafana. Working on Loki/Explore. Formerly @kausalco, @weaveworks, @oracle. Fuelled by cheesecake.
Berlin, Germany
Joined May 2014
- Tweets866
- Following305
- Followers603
- Likes1.2K








Pinned Tweet
My take on the last year. It’s been challenging but feeling insanely lucky to work at that place.

"Leadership was in full support of putting our employees' physical and mental health first... Now having this backing from the top is one thing, but to personally feel that it’s OK to finish early one day and support your spouse is another thing." @davkals grafana.com/blog/2021/02/19/…

Demoing live data streaming in @grafana and the new canvas panel to control a fleet of devices (or a data center). Amazing work by the Grafana Edge team 🎉
Today on the blog, @Atif_ShoukatAli shares an experimental project that demos how remote drone tracking and management are possible with a Grafana dashboard grafana.com/blog/2022/02/09/…

Grafana users! Do you know colleagues or friends who would be interested to use @grafana but can’t because of its inaccessibility? We are looking for screen reader users at this moment to help us test a new feature. Drop me a line at [email protected] #accessibility #ux

🦉 Today's Loki Tip 🦉
➡️ Check out the new log Browser for Loki (Grafana 7.5+). No more scrolling with a huge list of log streams. The browser makes label/value discovery and query building a breeze.
Nice work by @davkals and team. Enjoy!
#grafana #grafanaloki #loki
Yup, +1 on all of this. @grafana we're doing 360s as well, but try tweaking it every time. Here are some thoughts on our last iteration. 🧵

Our newly formed team @grafana around industrial use cases is already busy. Getting #modbus data into Grafana is only the start. We'd love to hear about your use cases! #IoT
On the blog today, @Atif_ShoukatAli walks us through how easy it is to get data from complicated industrial IoT systems into @PrometheusIO and Grafana with Grafana Cloud. grafana.com/blog/2021/04/05/…

🔥

We've got some big announcements in next week @grafana ObservabilityCON's keynote; heres a sneak peak... grafana.com/about/events/obs…


X-Ray is an interesting take on Tracing. My team has been working on this for a while. Very happy to see this live 🚀🎉
In collaboration with the AWS team, we have just launched another AWS integration, the X-ray data source. Read more on the blog: grafana.com/blog/2020/10/05/…

A @woltapp rider at full speed nearly ran over our 5yo and another 4yo in Pberg. We were on the pedestrian crossing and he was running a red light, was looking at his phone, and was wearing headphones. Maximum irresponsible 😡 Happened at 20:18 near
goo.gl/maps/ZD5zTim45ScBSUWy…
2
Work with us on improving the UX of @grafana and Loki. We got some great senior UX talent, this is your chance to grow 🐣💪🚀 apply.workable.com/grafana-l…
Here is your next chance to get in touch with us about @grafana UX issues.
This Post is from an account that no longer exists. Learn more
Anything we can change in Grafana's UX to make your life easier? Tonight is your chance: Grafana UX community call. 👇⭐️
This Post is from an account that no longer exists. Learn more
Excited about our UX team’s first community call. Get in there if you want to discuss new dashboard editing features.
This Post is from an account that no longer exists. Learn more
1
4
Trying to travel more responsibly with train and rental car (for last mile) is still being made difficult by rental companies like @Avis closing their Munich central station office at 5pm on a Saturday while airport offices continue to enjoy long hours.
2
2
Slides for my talk at #AllSystemsGo about Effective Infrastructure Monitoring with @PrometheusIO / Node exporter / @grafana
speakerdeck.com/davkal/effec…
@ASGConf #monitoring

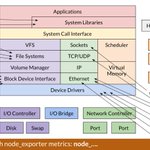
Come early tomorrow for my talk at #AllSystemsGo on Linux monitoring with @PrometheusIO and @grafana. Ben Kochie and I have been busy mapping node exporter metrics to system parts. #monitoring

5
Come early tomorrow for my talk at #AllSystemsGo on Linux monitoring with @PrometheusIO and @grafana. Ben Kochie and I have been busy mapping node exporter metrics to system parts. #monitoring

See @davkals show @grafana's advanced features to manage a fleet of Linux hosts. Join him at #AllSystemsGo Sep. 20-22, 2019 in Berlin.
Full Schedule & registration: buff.ly/2ZUKTPt

This is in reference to the well-known perf tools map by Brendan Gregg brendangregg.com/linuxperf.h…, but as metrics.
2
I'm trying to understand the #TwitterLayout update for desktop. In my timeline 4 in 5 tweets have attachments, so now I can only see 2 tweets at a time while scrolling on a retina 13" laptop. 30 secs in I'm exhausted. Scanning your timeline should not be that taxing. #ux