


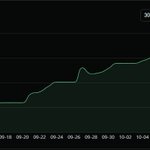



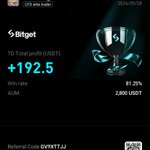


ALT Screenshot of the PnL chart from my XauScalping50x Bitget profile with the 30D filter, captured 12 Oct 2026. A green line generally rises with visible dips, particularly around 16 Sep and 27 Sep. The vertical axis is labeled 0 to 800; date ticks run from 12 Sep to 10 Oct. This is a platform display, not audited performance or a forecast; its endpoint differs from the separate 30D summary.

ALT Screenshot of the ROI chart from my XauScalping50x Bitget profile with the 30D filter, captured 12 Oct 2026. A green line generally rises with visible dips around 16 Sep and 27 Sep. The vertical axis is labeled 0% to 300%; date ticks run from 12 Sep to 10 Oct. This is a historical platform display, not a forecast. Its endpoint differs from the separate 30D ROI summary.


