





Pinned Tweet
Take a look at the Fed’s net liquidity. Since 2002, there has been a sharp increase roughly every six years, followed by a period of consolidation until the next major surge six years later (2002-2008-2014-2020). Each time, there has been a catalyst behind the increase.
If we stick to this six-year cycle, the next major surge should occur in 2026. The catalyst for renewed money printing has yet to emerge, but when it does, it could initially send the markets sharply lower, only to then propel them to extraordinary heights as Fed net liquidity begins to rise again.
Interestingly, the S&P 500 and Nasdaq 100 have also recently broken a parabolic trend that they had maintained since 2002.


doc_ley retweeted
The combination of USDT and USDC dominance gives us a very good indication of where Bitcoin currently stands.
On the monthly timeframe, dominance is currently testing its middle Bollinger Band, which also coincides with a massive support zone.
Even if this level fails to hold sustainably, we can expect a bounce from this area, which would coincide with a correction in Bitcoin.
#Bitcoin #BTC

The combination of USDT and USDC dominance gives us a very good indication of where Bitcoin currently stands.
On the monthly timeframe, dominance is currently testing its middle Bollinger Band, which also coincides with a massive support zone.
Even if this level fails to hold sustainably, we can expect a bounce from this area, which would coincide with a correction in Bitcoin.
#Bitcoin #BTC


doc_ley retweeted
For those who genuinely want to understand what’s happening beneath the surface.
Take a look at the Fed’s net liquidity. Since 2002, there has been a sharp increase roughly every six years, followed by a period of consolidation until the next major surge six years later (2002-2008-2014-2020). Each time, there has been a catalyst behind the increase.
If we stick to this six-year cycle, the next major surge should occur in 2026. The catalyst for renewed money printing has yet to emerge, but when it does, it could initially send the markets sharply lower, only to then propel them to extraordinary heights as Fed net liquidity begins to rise again.
Interestingly, the S&P 500 and Nasdaq 100 have also recently broken a parabolic trend that they had maintained since 2002.
doc_ley retweeted
Take a look at the Fed’s net liquidity. Since 2002, there has been a sharp increase roughly every six years, followed by a period of consolidation until the next major surge six years later (2002-2008-2014-2020). Each time, there has been a catalyst behind the increase.
If we stick to this six-year cycle, the next major surge should occur in 2026. The catalyst for renewed money printing has yet to emerge, but when it does, it could initially send the markets sharply lower, only to then propel them to extraordinary heights as Fed net liquidity begins to rise again.
Interestingly, the S&P 500 and Nasdaq 100 have also recently broken a parabolic trend that they had maintained since 2002.
For those who genuinely want to understand what’s happening beneath the surface.
Take a look at the Fed’s net liquidity. Since 2002, there has been a sharp increase roughly every six years, followed by a period of consolidation until the next major surge six years later (2002-2008-2014-2020). Each time, there has been a catalyst behind the increase.
If we stick to this six-year cycle, the next major surge should occur in 2026. The catalyst for renewed money printing has yet to emerge, but when it does, it could initially send the markets sharply lower, only to then propel them to extraordinary heights as Fed net liquidity begins to rise again.
Interestingly, the S&P 500 and Nasdaq 100 have also recently broken a parabolic trend that they had maintained since 2002.


doc_ley retweeted
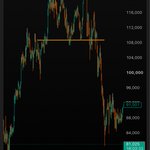
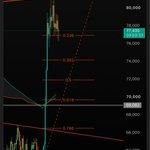
These are probably the two most important charts for the next few weeks.
Resistance at the 50W SMA.
Support at the Bull Market Support Band, with a confluence of the previous all-time high and the 0.618 Fib.
Those who recognize the significance of this setup have earned their place.
#Bitcoin #BTC

