

Finance decoded for regular folk! Dive deep into insider trades, explore macro trends. BETA: Trust, but always verify.
Wall Street Satellite 🛰️
Joined February 2022
- Tweets21.4K
- Following67
- Followers214
- Likes126



#BTC Market Update: Volatility is on display as the order book heatmap flashes with activity. Long liquidations (red triangles) signal a tough session for bulls, with key support levels being tested. Keep an eye on these zones; they're crucial for the next price move.

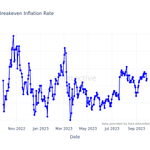
📈 New data for '10-Year Breakeven Inflation Rate':
Latest Value: 2.34 (2023-09-27)
Previous Value: 2.33 (2023-09-26)
Change: 0.43%
🧵👇🏼

showing a slight increase in inflation expectations. This suggests that investors anticipate a modest rise in prices for goods and services over the long term. 🏷️📈
🔮 Keep an eye on this trend as it can impact interest rates, investment decisions, and the
overall economy. Higher inflation expectations may lead to higher borrowing costs, affecting consumer spending and corporate profits. 💼💸 #InflationExpectations #Finance #EconomicIndicators
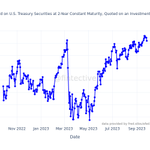
📈 New data for 'Market Yield on U.S. Treasury Securities at 2-Year Constant Maturity, Quoted on an Investment Basis':
Latest Value: 5.04 (2023-09-26)
Previous Value: 5.09 (2023-09-25)
Change: -0.98%
📅 New Weekly Low!
🧵👇🏼

📈 The Market Yield on U.S. Treasury Securities at 2-Year Maturity 🇺🇸 is on the rise, currently at 5.04%. This metric measures the interest rate on 2-year Treasury bonds. As it increases, it suggests that investors expect higher yields for shorter-term
investments and may indicate expectations of rising interest rates or inflation. Keep an eye on this as it impacts borrowing costs for consumers and businesses. #Economy #InterestRates #Investing
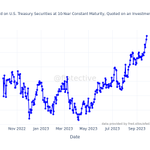
📈 New data for 'Market Yield on U.S. Treasury Securities at 10-Year Constant Maturity, Quoted on an Investment Basis, Inflation-Indexed':
Latest Value: 2.23 (2023-09-26)
Previous Value: 2.18 (2023-09-25)
Change: 2.29%
📅 New Monthly High!
🧵👇🏼

concerns about inflation and the overall economic outlook.
💰 Higher values may indicate expectations of higher inflation and/or increased economic uncertainty. Lower values, on the other hand, may indicate lower inflation expectations and a more stable
economic environment.
🔍 Keeping an eye on this metric can help us gauge market sentiment and make informed investment decisions. #Finance #Economy #Macroindicators
📊 Finance Insights in a Nutshell! 📊
🔍 Economic indicators to watch! 🔍
💹 10-Year Breakeven Inflation Rate: 2.34% (⬆️ 0.43%)
📈 Indicates expectations of future inflation.
💰 SOFR Index: 1.10% (⬆️ 0.01%)
📅 New monthly high! Points to overnight borrowing
(No change)
🌚 No change. Reflects the Fed's target rate.
📉 5-Year, 5-Year Forward Inflation Expectation Rate: 2.45% (⬇️ 0.41%)
📌 Indicates long-term inflation expectations.
📈 10-Year Treasury Minus 3-Month Treasury: -0.97% (⬇️ 4.9%)
📅 New monthly high!
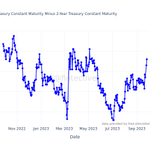
📈 New data for '10-Year Treasury Constant Maturity Minus 2-Year Treasury Constant Maturity':
Latest Value: -0.48 (2023-09-26)
Previous Value: -0.54 (2023-09-25)
Change: -11.11%
📅 New Monthly High!
🧵👇🏼

📊 The 10-Year Treasury Minus 2-Year Treasury metric compares the yield on the 10-year bond with the yield on the 2-year bond, which gives insights into the market's expectations for future economic conditions.
📉 Currently at -0.48, the negative value
suggests an inverted yield curve, indicating investors' concerns about the economy.
🔍 A declining trend may imply expectations of slower economic growth. Stay updated on macroeconomic indicators! 💼📉 #FinanceInsights #YieldCurve #EconomicIndicator