

St Louis & Evansville | Team Adjusted Goalie Model Creator | Skater Quality Models & Metrics | Salary Cap Data | Advanced Stats | Analytics | Tax Calculator
- Tweets2.3K
- Following1.1K
- Followers306
- Likes97






ALT Lines and pairs advanced table at 5v5: time on ice, average SDQ and SOQ, expected goals for and against and xG share for each line and pair. New York Islanders 2, San Jose Sharks 3 (Final/So). Best NYI unit: Hutton-Kessel (76% xG, 0.62-0.19). Best SJS unit: Toffoli-Dellandrea-Stenberg (76% xG, 0.55-0.18).

ALT Goalie panels with standard advanced and Flying Mitts TAGP metrics. New York Islanders 2, San Jose Sharks 3 (Final/So). I. Sorokin: 37 saves, GSAx +1.60, GSOx +1.43. Y. Askarov: 30 saves, GSAx +1.32, GSOx +0.79.

ALT Game flow chart: win probability, cumulative xG and momentum over the game. New York Islanders 2, San Jose Sharks 3 (Final/So). Pregame favorite SJS 63.1%. Biggest swing: T. Toffoli (SJS) goal at 12:12 P2, SJS +23%. xG 3.32 to 3.60, high-danger chances 5 to 5.

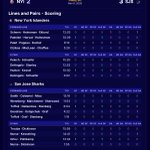
ALT Lines and pairs scoring table. New York Islanders 2, San Jose Sharks 3 (Final/So). Top units: Palmieri-Horvat-Holmstrom (1 GF, 0 GA); Orlov-Pohlkamp (1 GF, 0 GA).

ALT New York Islanders 2, San Jose Sharks 3 (Final/So). Shots 32-39, power play 1/4 and 0/4, faceoffs 58.2% and 41.8%.

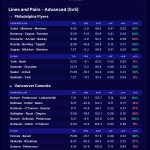
ALT Lines and pairs advanced table at 5v5: time on ice, average SDQ and SOQ, expected goals for and against and xG share for each line and pair. Philadelphia Flyers 3, Vancouver Canucks 1 (Final). Best PHI unit: Cates-Michkov-Martone (95% xG, 0.41-0.02). Best VAN unit: Boeser-DeBrusk-Pettersson (100% xG, 0.29-0.00).

ALT Goalie panels with standard advanced and Flying Mitts TAGP metrics. Philadelphia Flyers 3, Vancouver Canucks 1 (Final). J. Woll: 18 saves, GSAx +0.91, GSOx +1.53. L. Meriläinen: 14 saves, GSAx -0.63, GSOx +1.17.

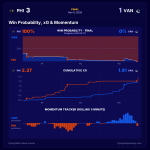
ALT Game flow chart: win probability, cumulative xG and momentum over the game. Philadelphia Flyers 3, Vancouver Canucks 1 (Final). Pregame favorite PHI 70.3%. Biggest swing: M. Bunting (PHI) goal at 2:03 P1, PHI +12%. xG 2.37 to 1.91, high-danger chances 5 to 3.

ALT Lines and pairs scoring table. Philadelphia Flyers 3, Vancouver Canucks 1 (Final). Top units: Sanheim-Drysdale (1 GF, 0 GA); Hronek-Buium (0 GF, 0 GA).

ALT Tampa Bay Lightning 2026-27 cap sheet, Nov 9, 2026: Projected cap hit $101,267,026 (Cap hit today $101.25M · 152 days left); Cap space $3,488,138 (Projected $2.73M); LTIR relief — (Nobody on LTIR); Dead cap —; Roster 23 / 23 (0 open); Contracts 48 / 50 (2 open); 2027-28 space $29,800,000 ($83.7M · 15 signed); 2028-29 space $63,516,667 ($63.98M · 11 signed).

ALT Philadelphia Flyers 3, Vancouver Canucks 1 (Final). Shots 17-19, power play 1/2 and 1/5, faceoffs 50.0% and 50.0%.

ALT Lines and pairs advanced table at 5v5: time on ice, average SDQ and SOQ, expected goals for and against and xG share for each line and pair. New York Rangers 1, Edmonton Oilers 3 (Final). Best NYR unit: Robertson-Morrow (94% xG, 0.38-0.03). Best EDM unit: Draisaitl-McDavid-Podkolzin (68% xG, 0.61-0.29).

ALT Goalie panels with standard advanced and Flying Mitts TAGP metrics. New York Rangers 1, Edmonton Oilers 3 (Final). D. Garand: 17 saves, GSAx -1.33, GSOx -0.42. D. Levi: 28 saves, GSAx +2.12, GSOx +2.03.

ALT Game flow chart: win probability, cumulative xG and momentum over the game. New York Rangers 1, Edmonton Oilers 3 (Final). Pregame favorite EDM 64.5%. Biggest swing: J. Chmelar (NYR) goal at 5:05 P2, NYR +16%. xG 3.12 to 1.67, high-danger chances 3 to 2.

ALT Lines and pairs scoring table. New York Rangers 1, Edmonton Oilers 3 (Final). Top units: Zibanejad-Lafrenière-Perreault (0 GF, 0 GA); Ekholm-Bouchard (2 GF, 0 GA).

ALT New York Rangers 1, Edmonton Oilers 3 (Final). Shots 29-20, power play 0/5 and 0/3, faceoffs 54.4% and 45.6%.

ALT Team Landscape chart: Discipline (Penalties drawn vs taken, per 60 minutes), all NHL teams through Nov 9. Each team logo sits at its Drawn/60 (across) and Taken/60 (up); top right is "Clean & Dangerous". Best Drawn/60: Florida Panthers. Best Taken/60: New Jersey Devils. Best overall: New Jersey Devils. Worst overall: Dallas Stars. In the top-right corner: Lightning, Kraken, Wild, Avalanche, Red Wings. Highlighted: New York Islanders, Drawn/60 3.94 (15th), Taken/60 4.56 (27th), in "Undisciplined".

ALT Buffalo Sabres schedule, Nov 9, 2026. Team rating 98.3 (20th of 32). Record 8-6-3, 19 points. Projected 40-33-11, 91 points. Remaining strength of schedule 101.0, 5th hardest. Overall 100.8, 2nd hardest. Bar chart of the 67 games left, one bar per game, taller and redder for tougher opponents. Next: Nov 11 vs TBL, Nov 12 @ CHI, Nov 14 @ DAL.

ALT Philadelphia Flyers 2026-27 cap sheet, Nov 9, 2026: Projected cap hit $93,844,888 (Cap hit today $94.08M · 153 days left); Cap space $12,876,417 (Projected $10.16M); LTIR relief — (Nobody on LTIR); Dead cap $1,200,000 (Retained $1.2M); Roster 23 / 23 (0 open); Contracts 47 / 50 (3 open); 2027-28 space $24,580,417 ($88.92M · 22 signed); 2028-29 space $56,025,000 ($71.48M · 11 signed).

ALT Team Landscape chart: Special Teams (Power play vs penalty kill), all NHL teams through Nov 8. Each team logo sits at its PP% (across) and PK% (up); top right is "Special". Best PP%: Utah Mammoth. Best PK%: Dallas Stars. Best overall: Nashville Predators. Worst overall: Vancouver Canucks. In the top-right corner: Predators, Stars, Maple Leafs, Flames, Panthers, Blues, Wild, Avalanche. Highlighted: San Jose Sharks, PP% 21.4% (18th), PK% 76.5% (17th), in "Both Broken".