

Investor Learner Observer
Joined September 2023
- Tweets30.1K
- Following97
- Followers20.9K
- Likes3.8K




Pinned Tweet
Posting every result in real time has become extremely tiring and exhausting
I'm currently completely burned out
Covering almost 150 results every day takes up nearly my entire day and has started affecting my overall schedule, especially my sleep
Moreover, with so many X accounts now posting results using AI, getting access to result updates has become much easier
It also started feeling like an endless loop, with no real break
So, I've decided to stop posting every company's results
However, I'll continue sharing:
1) Newspaper Readings
2) Business Updates
3) Auto Sales Data
4) Company Press Releases, especially those highlighting interesting developments and results
5) Interesting Businesses worth reading about
Time to step back, reduce the noise, reclaim some personal time and focus on what I genuinely enjoy
☮️
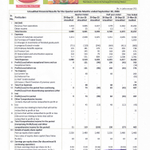
Euro India Fresh Foods — Q2FY27 Results 🔔
#Q2Results #Q2FY27 #Euroinda
Revenue ₹29.92 Cr vs ₹32.47 Cr
(-7.85% YoY┃-17.03% QoQ)
EBITDA ₹3.79 Cr vs ₹0.82 Cr
(+362.20% YoY┃+6.76% QoQ)
EBITDA Margin 12.67% vs 2.53% YoY & 9.84% QoQ
PBT +₹0.09 Cr vs -₹0.90 Cr YoY & +₹1.21 Cr QoQ
(-92.56% QoQ)
PAT +₹0.09 Cr vs -₹0.90 Cr YoY & +₹0.74 Cr QoQ
(-87.84% QoQ)
Other Income ₹0.97 Cr vs ₹0.02 Cr YoY & ₹0.25 Cr QoQ

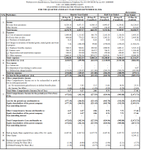
Fratelli Vineyards — Q2FY27 Results 🔔
#Q2Results #Q2FY27 #Fratelli
Revenue ₹39.18 Cr vs ₹40.07 Cr
(-2.21% YoY┃+6.03% QoQ)
EBITDA -₹1.48 Cr vs ₹0.78 Cr YoY & ₹0.30 Cr QoQ
EBITDA Margin -3.77% vs 1.96% YoY & 0.80% QoQ
PBT -₹6.32 Cr vs -₹4.43 Cr YoY & -₹4.96 Cr QoQ
PAT -₹4.77 Cr vs -₹3.31 Cr YoY & -₹3.67 Cr QoQ
Other Income ₹1.51 Cr vs ₹0.54 Cr YoY & ₹0.66 Cr QoQ

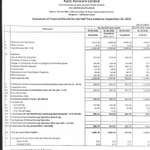
Apsis Aerocom (SME) — H1FY27 Results 🔔
#H1Results #H1FY27 #Apsis
H1FY27 vs H1FY26
Revenue ₹21.17 Cr vs ₹13.65 Cr (+55.10% YoY)
EBITDA ₹6.44 Cr vs ₹4.76 Cr (+35.16% YoY)
EBITDA Margin 30.40% vs 34.89% YoY
PBT ₹5.31 Cr vs ₹4.25 Cr (+24.91% YoY)
PAT ₹3.97 Cr vs ₹3.27 Cr (+21.43% YoY)
Other Income ₹0.08 Cr vs ₹0.04 Cr YoY

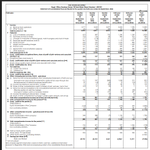
Shri Jagdamba Polymers — Q2FY27 Results 🔔
#Q2Results #Q2FY27 #Shrijagdamba
Revenue ₹202.50 Cr vs ₹111.77 Cr
(+81.18% YoY┃+5.23% QoQ)
EBITDA ₹34.33 Cr vs ₹16.53 Cr
(+107.63% YoY┃+8.99% QoQ)
EBITDA Margin 16.95% vs 14.79% YoY & 16.37% QoQ
PBT ₹30.17 Cr vs ₹11.75 Cr
(+156.76% YoY┃+14.43% QoQ)
PAT ₹22.14 Cr vs ₹7.38 Cr
(+199.85% YoY┃+10.66% QoQ)
PAT After Minority interest ₹21.05 Cr vs ₹7.95 Cr
(+164.78% YoY┃+6.35% QoQ)
Other Income ₹0.99 Cr vs ₹1.20 Cr YoY & ₹2.14 Cr QoQ

Tata Chemicals — Q2FY27 Results 🔔
#Q2Results #Q2FY27 #tatachemicals
Revenue ₹4177 Cr vs ₹3877 Cr
(+7.74% YoY┃-1.83% QoQ)
EBITDA ₹381 Cr vs ₹537 Cr
(-29.05% YoY┃-31.35% QoQ)
EBITDA Margin 9.12% vs 13.85% YoY & 13.04% QoQ
PBT Before Exceptional Items & Share of JV/Associates
-₹26 Cr vs +₹246 Cr YoY & +₹127 Cr QoQ
PBT (Excl. Exceptional) -₹6 Cr vs +₹301 Cr YoY & +₹110 Cr QoQ
PAT -₹50 Cr vs +₹154 Cr YoY & +₹60 Cr QoQ
PAT After Minority interest
-₹122 Cr vs +₹77 Cr YoY & -₹17 Cr QoQ
Other Income ₹95 Cr vs ₹138 Cr YoY & ₹56 Cr QoQ
In Q2FY26 Exceptional loss of ₹65 Cr

ASM Technologies — Q2FY27 Results 🔔
#Q2Results #Q2FY27 #ASM
Revenue ₹268.37 Cr vs ₹154.46 Cr
(+73.75% YoY┃+34.98% QoQ)
EBITDA ₹58.99 Cr vs ₹30.47 Cr
(+93.60% YoY┃+28.38% QoQ)
EBITDA Margin 21.98% vs 19.73% YoY & 23.11% QoQ
PBT ₹48.29 Cr vs ₹26.37 Cr
(+83.15% YoY┃+23.82% QoQ)
PAT ₹34.48 Cr vs ₹19.12 Cr
(+80.36% YoY┃+28.59% QoQ)
PAT After Minority interest ₹30.67 Cr vs ₹19.12 Cr
(+60.43% YoY┃+14.36% QoQ)
Other Income ₹0.64 Cr vs ₹1.28 Cr YoY & ₹2.03 Cr QoQ

Prostarm Info Systems — Q2FY27 Results 🔔
#Q2Results #Q2FY27 #Prostarm
Revenue ₹120.01 Cr vs ₹65.92 Cr
(+82.06% YoY┃+57.81% QoQ)
EBITDA ₹9.35 Cr vs ₹11.21 Cr
(-16.59% YoY┃+44.13% QoQ)
EBITDA Margin 7.79% vs 17.01% YoY & 8.53% QoQ
PBT ₹8.13 Cr vs ₹11.09 Cr
(-26.74% YoY┃+32.31% QoQ)
PAT ₹6.07 Cr vs ₹8.27 Cr
(-26.53% YoY┃+32.63% QoQ)
Other Income ₹1.76 Cr vs ₹1.52 Cr YoY & ₹2.53 Cr QoQ

Vishnusurya Projects and Infra (SME) — Q2FY27 Results 🔔
#Q2Results #Q2FY27 #Vishnusurya
Revenue ₹69.33 Cr vs ₹118.65 Cr
(-41.56% YoY┃+12.06% QoQ)
EBITDA ₹7.97 Cr vs ₹29.51 Cr
(-73.00% YoY┃-28.03% QoQ)
EBITDA Margin 11.49% vs 24.87% YoY & 17.90% QoQ
PBT ₹4.23 Cr vs ₹25.70 Cr
(-83.53% YoY┃-43.38% QoQ)
PAT ₹3.28 Cr vs ₹24.35 Cr
(-86.53% YoY┃-44.56% QoQ)
Other Income ₹0.18 Cr vs ₹0.48 Cr YoY & ₹0.31 Cr QoQ

Suprajit Engineering — Q2FY27 Results 🔔
#Q2Results #Q2FY27 #suprajit
Revenue ₹1135.14 Cr vs ₹941.02 Cr
(+20.63% YoY┃+6.13% QoQ)
EBITDA ₹138.44 Cr vs ₹99.59 Cr
(+39.00% YoY┃+7.55% QoQ)
EBITDA Margin 12.20% vs 10.58% YoY & 12.03% QoQ
PBT ₹84.88 Cr vs ₹81.19 Cr
(+4.54% YoY┃+11.03% QoQ)
PAT ₹53.37 Cr vs ₹50.95 Cr
(+4.75% YoY┃+2.18% QoQ)
Other Income ₹4.03 Cr vs ₹34.70 Cr YoY & ₹4.22 Cr QoQ

Spectrum Electrical Industries — Q2FY27 Results 🔔
#Q2Results #Q2FY27 #Spectrum
Blockbuster 🔥
Revenue ₹198.39 Cr vs ₹117.68 Cr
(+68.58% YoY┃+28.37% QoQ)
EBITDA ₹37.66 Cr vs ₹15.22 Cr
(+147.40% YoY┃+55.35% QoQ)
EBITDA Margin 18.98% vs 12.94% YoY & 15.69% QoQ
PBT ₹29.43 Cr vs ₹11.85 Cr
(+148.34% YoY┃+66.91% QoQ)
PAT ₹18.08 Cr vs ₹7.81 Cr
(+131.52% YoY┃+38.52% QoQ)
PAT After Minority interest ₹18.06 Cr vs ₹7.75 Cr
(+133.09% YoY┃+38.59% QoQ)
Other Income ₹1.38 Cr vs ₹2.16 Cr YoY & ₹1.98 Cr QoQ

Surya Roshni — Q2FY27 Results 🔔
#Q2Results #Q2FY27 #Suryaroshni
Revenue ₹2448.48 Cr vs ₹1845.16 Cr
(+32.70% YoY┃+19.64% QoQ)
EBITDA ₹136.67 Cr vs ₹118.26 Cr
(+15.57% YoY┃+21.70% QoQ)
EBITDA Margin 5.58% vs 6.41% YoY & 5.49% QoQ
PBT ₹103.11 Cr vs ₹99.62 Cr
(+3.50% YoY┃+27.79% QoQ)
PAT ₹76.73 Cr vs ₹74.19 Cr
(+3.42% YoY┃+28.74% QoQ)
Other Income ₹6.13 Cr vs ₹22.54 Cr YoY & ₹8.00 Cr QoQ

Sheetal Cool Products — Q2FY27 Results 🔔
#Q2Results #Q2FY27 #SheetalCool
Revenue ₹65.31 Cr vs ₹55.81 Cr
(+17.02% YoY┃-50.76% QoQ)
EBITDA ₹8.36 Cr vs ₹6.21 Cr
(+34.71% YoY┃-40.20% QoQ)
EBITDA Margin 12.81% vs 11.12% YoY & 10.54% QoQ
PBT ₹4.83 Cr vs ₹2.17 Cr
(+122.29% YoY┃-48.29% QoQ)
PAT ₹3.24 Cr vs ₹1.59 Cr
(+103.02% YoY┃-53.67% QoQ)

Andhra Sugars — Q2FY27 Results 🔔
#Q2Results #Q2FY27 #Andhrasugar
Revenue ₹630.23 Cr vs ₹597.46 Cr
(+5.48% YoY┃+0.50% QoQ)
EBITDA ₹40.60 Cr vs ₹55.09 Cr
(-26.29% YoY┃-44.68% QoQ)
EBITDA Margin 6.44% vs 9.22% YoY & 11.70% QoQ
PBT (Excl. Exceptional) ₹29.71 Cr vs ₹40.63 Cr
(-26.89% YoY┃-53.43% QoQ)
PAT from Continuing Operations ₹22.78 Cr vs ₹33.56 Cr
(-32.12% YoY┃-51.14% QoQ)
PAT ₹22.47 Cr vs ₹33.56 Cr
(-33.04% YoY┃-51.81% QoQ)
PAT After Minority interest ₹23.37 Cr vs ₹32.67 Cr
(-28.46% YoY┃-48.75% QoQ)
Other Income ₹9.95 Cr vs ₹6.83 Cr YoY & ₹10.69 Cr QoQ
In Q2FY26 Exceptional Gain of ₹3.08 Cr

Heranba Industries — Q2FY27 Results 🔔
#Q2Results #Q2FY27 #Heranba
Revenue ₹372.09 Cr vs ₹521.71 Cr
(-28.68% YoY┃-2.90% QoQ)
EBITDA ₹31.85 Cr vs ₹48.84 Cr
(-34.79% YoY┃-35.13% QoQ)
EBITDA Margin 8.56% vs 9.36% YoY & 12.81% QoQ
PBT -₹1.50 Cr vs +₹7.74 Cr YoY & +₹20.10 Cr QoQ
PAT +₹2.64 Cr vs -₹2.14 Cr YoY & +₹7.03 Cr QoQ
(-62.45% QoQ)
PAT After Minority interest
+₹3.04 Cr vs -₹1.45 Cr YoY & +₹7.14 Cr QoQ
(-57.42% QoQ)
Other Income ₹0.03 Cr vs -₹3.12 Cr YoY & ₹5.85 Cr QoQ

Finolex Cables — Q2FY27 Results 🔔
#Q2Results #Q2FY27 #Finolex
Revenue ₹2269.33 Cr vs ₹1375.79 Cr
(+64.95% YoY┃+12.73% QoQ)
EBITDA ₹311.22 Cr vs ₹145.11 Cr
(+114.47% YoY┃+27.46% QoQ)
EBITDA Margin 13.71% vs 10.55% YoY & 12.13% QoQ
PBT Before Share of JV/Associates ₹321.39 Cr vs ₹168.09 Cr
(+91.20% YoY┃+17.44% QoQ)
PBT ₹356.65 Cr vs ₹206.20 Cr
(+72.96% YoY┃+13.42% QoQ)
PAT ₹272.92 Cr vs ₹162.64 Cr
(+67.81% YoY┃+9.59% QoQ)
Other Income ₹33.41 Cr vs ₹37.46 Cr YoY & ₹51.49 Cr QoQ

HBL Engineering — Q2FY27 Results 🔔
#Q2Results #Q2FY27 #HBLENGINE
Revenue ₹871.56 Cr vs ₹1222.90 Cr
(-28.73% YoY┃+36.60% QoQ)
EBITDA ₹229.85 Cr vs ₹544.05 Cr
(-57.75% YoY┃+56.64% QoQ)
EBITDA Margin 26.37% vs 44.49% YoY & 23.00% QoQ
PBT (Excl. Exceptional) ₹232.40 Cr vs ₹544.21 Cr
(-57.30% YoY┃+55.49% QoQ)
PAT Before Share of JV/Associates ₹185.51 Cr vs ₹387.45 Cr
(-52.12% YoY┃+67.26% QoQ)
PAT ₹192.75 Cr vs ₹387.25 Cr
(-50.23% YoY┃+76.61% QoQ)
PAT After Minority interest ₹192.51 Cr vs ₹387.26 Cr
(-50.29% YoY┃+76.49% QoQ)
Other Income ₹22.11 Cr vs ₹15.78 Cr YoY & ₹20.56 Cr QoQ
This Q2 Exceptional Gain of ₹13.16 Cr

Mamata Machinery — Q2FY27 Results 🔔
#Q2Results #Q2FY27 #Mamata
Revenue ₹41.05 Cr vs ₹53.37 Cr
(-23.09% YoY┃+13.15% QoQ)
EBITDA -₹0.85 Cr vs +₹6.78 Cr YoY & -₹4.70 Cr QoQ
EBITDA Margin -2.07% vs +12.69% YoY & -12.96% QoQ
PBT -₹1.37 Cr vs +₹6.33 Cr YoY & -₹4.21 Cr QoQ
PAT -₹1.05 Cr vs +₹4.53 Cr YoY & -₹3.47 Cr QoQ
Other Income ₹1.02 Cr vs ₹0.80 Cr YoY & ₹1.78 Cr QoQ

Remsons Industries — Q2FY27 Results 🔔
#Q2Results #Q2FY27 #remsons
Revenue ₹135.47 Cr vs ₹115.59 Cr
(+17.20% YoY┃+13.15% QoQ)
EBITDA ₹12.24 Cr vs ₹13.32 Cr
(-8.08% YoY┃+17.29% QoQ)
EBITDA Margin 9.04% vs 11.52% YoY & 8.72% QoQ
PBT (Excl. Exceptional) ₹6.42 Cr vs ₹8.18 Cr
(-21.51% YoY┃+49.47% QoQ)
PAT ₹4.63 Cr vs ₹6.39 Cr
(-27.54% YoY┃+43.67% QoQ)
PAT After Minority interest ₹4.74 Cr vs ₹4.06 Cr
(+16.68% YoY┃+64.79% QoQ)
Other Income ₹0.99 Cr vs ₹0.87 Cr YoY & ₹0.61 Cr QoQ

Tata Steel — Q2FY27 Results 🔔
#Q2Results #Q2FY27 #tatasteel
Revenue ₹65436.24 Cr vs ₹58689.29 Cr
(+11.50% YoY┃+7.64% QoQ)
EBITDA ₹10533.07 Cr vs ₹8896.54 Cr
(+18.40% YoY┃+13.69% QoQ)
EBITDA Margin 16.10% vs 15.16% YoY & 15.24% QoQ
PBT (Excl. Exceptional) ₹5106.47 Cr vs ₹4642.88 Cr
(+9.98% YoY┃+22.08% QoQ)
PAT ₹3699.59 Cr vs ₹3183.09 Cr
(+16.23% YoY┃+55.10% QoQ)
PAT After Minority interest ₹3666.41 Cr vs ₹3101.75 Cr
(+18.20% YoY┃+58.15% QoQ)
Other Income ₹248.28 Cr vs ₹363.55 Cr YoY & ₹232.68 Cr QoQ
This Q2 Exceptional Gain of ₹348.68 Cr

MIC Electronics — Q2FY27 Results 🔔
#Q2Results #Q2FY27 #MIC
Revenue ₹91.01 Cr vs ₹37.89 Cr
(+140.19% YoY┃+108.16% QoQ)
EBITDA ₹6.48 Cr vs ₹3.81 Cr
(+70.01% YoY┃+51.71% QoQ)
EBITDA Margin 7.12% vs 10.06% YoY & 9.77% QoQ
PBT ₹4.60 Cr vs ₹2.17 Cr
(+112.29% YoY┃+115.88% QoQ)
PAT ₹4.60 Cr vs ₹2.17 Cr
(+112.29% YoY┃+115.88% QoQ)
Other Income ₹0.46 Cr vs ₹0.53 Cr YoY & ₹0.22 Cr QoQ
