

DHM Research, Senior Vice President Also at @OregonAt100 for daily news from the past
Portland, Oregon
Joined October 2009
- Tweets7.6K
- Following776
- Followers3.6K
- Likes768






Democratic and Republican ballot share for each day in Oregon.
Oct 16: Dem 64%, Rep 17% (D +47)
Oct 19: Dem 48%, Rep 31% (D +17)
Oct 20: Dem 52%, Rep 26% (D +26)
Oct 21: Dem 53%, Rep 25% (D +28)
Oct 22: Dem 48%, Rep 29% (D +19)
Oct 23: Dem 41%, Rep 33% (D +8)
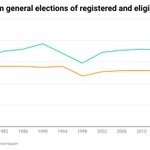
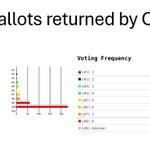
Oregon ballot return update and why it probably doesn't say much about final turnout. Those who have voted are just regular voters.
Democrats
-Voted in 8 of last 8 elections: 49%
-6+ of 8: 75%
-Age 65+: 64%


The final October consumer sentiment numbers are out from the University of Michigan. Here are the changes by party.
Dem 36.6 (+1.0)
Ind 42.4 (-5.3)
Rep 83.0 (+5.8)

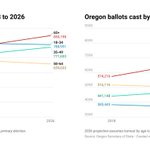
The age composition of Oregon's electorate from 2018 to 2026.
The projected ballots for 2026 assume that turnout by age is the average of 2018 and 2022.


I am tracking Oregon ballot returns, but avoiding reading anything into them. Those who have voted were almost certain to anyway.
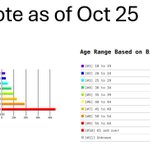
Ages and vote history of voters who have returned ballots.
Dems
-Age 65+: 65%
-Voted 8 of 8 of the past 8 primaries and generals: 53%
-6+ of 8: 78%

Reposting Republicans. There was a typo in my text. Republicans
-Age 65+: 65%
-8 of 8: 46%
-6+ of 8: 74%
Thanks to @SpaceOddities for pointing out the error.

Agree with Kevin.
Whether Oregon--or Texas, Wisconsin, etc.--allow data centers or not we will still have to make decisions about our relationships with AI.



Number of Oregon governor polls after the primary elections in 2022 vs. 2026.
2022: at least 15
2026: just 5 so far

They are a significant minority, but there are some registered Republicans and Republican voters in Portland.
Current registered Republicans: ~32,300
2022 Drazan votes: ~46,300
2024 Trump votes: ~42,700
