

Developing iO Charts, the Multi-Wallet DeFi and Stock Portfolio Tracker📈
Visit iO Charts👉
Joined November 2019
- Tweets4.1K
- Following693
- Followers1.1K
- Likes10.5K







Walmart Q1: revenue +7.3%, ads +37%, eCommerce +26%… and $WMT is down.
Q1 FY27:
• Revenue: $177.8B (+7.3%)
• Global eCommerce: +26%
• Advertising: +37%
• EPS: $0.67
• Comp sales: +4.1%
Strong quarter on paper. Yet $WMT dropped from ~$134 to ~$130.
Possible reasons:
→ Free cash flow swung negative to -$1.9B
→ Guidance reiterated, not raised
→ Stock was already +17% YTD at ~44x forward earnings
→ Operating income only +5%, with distribution fuel costs pressuring margins
Feels like a case of expectations > results.
$WMT is building a serious ads business and scaling eCommerce, but at 44x earnings the market may want more than “good.”
Is $WMT still a long-term compounder… or is the premium multiple starting to reset?
Buying, holding, or waiting?

$AMD is up roughly 27% since reporting Q1 2026 earnings on May 5.
On May 5, AMD was trading around $355 after earnings. Today the stock is sitting near $452 after one of the strongest post-earnings semiconductor rallies of the year.
The move started after $AMD reported stronger-than-expected Q1 numbers:
Q1 revenue: $10.25 billion versus $9.9 billion expected.
Data center revenue: $5.8 billion versus $5.56 billion expected.
Data center growth: +57% year over year.
Q2 guidance: ~$11.2 billion versus ~$10.5 billion expected.
AMD guided roughly $700 million above analyst expectations for Q2, signaling that AI and data center demand is accelerating faster than Wall Street modeled.
What's notable is the stock didn't just spike on earnings day and fade. Buyers kept stepping in throughout the following sessions as investors continued repricing AMD's role in the AI infrastructure market.
AMD's market cap is now around $735 billion with the stock trading near fresh all-time highs. The current 52-week high sits at $469.22.
The broader story behind the rally:
EPYC server CPUs continuing to take share from Intel
Instinct GPUs ramping across hyperscalers
Increasing demand for alternatives to Nvidia's AI ecosystem
Long-term AI growth expectations continuing to rise
The valuation debate is now getting louder. AMD trades around 148x trailing earnings, which bears argue is difficult to justify. Bulls argue earnings are still early in the AI infrastructure ramp and forward multiples could compress quickly if data center growth remains this strong.
For perspective, $AMD traded near $1.61 back in 2015. Today it's above $450 after one of the biggest semiconductor turnarounds in market history.
$NVDA trading near record highs alongside AMD also shows this isn't just company-specific momentum. The market is aggressively re-rating AI infrastructure companies across the board.
$AMD up ~27% since May 5 earnings. Data center revenue up 57%. Q2 guidance came in far above expectations. Market cap now above $735 billion.
At this point, is the market finally treating AMD as a true long-term AI heavyweight beside Nvidia?

72
Visa and Mastercard are down 18-19% from highs. Everyone is blaming stablecoins. They are wrong.
Real consumer stablecoin payments are about $390B per year. That is 2.3% of Visa's annual volume. 90% of stablecoin turnover is crypto-to-crypto trading, not people buying things. Meanwhile Mastercard acquired stablecoin company BVNK for $1.8B and Visa already launched USDC settlement. They are not getting disrupted. They are integrating it.
The actual threat is governments, not crypto
India built UPI and cut Visa and Mastercard's market share from 43% to 21% in six years. Brazil has PIX. The Netherlands has iDEAL, which now handles 70% of Dutch payments and completely bypasses card rails. The EU is scaling it to 580 million people. That is the real story. Not stablecoins.
And yet both stocks look cheap right now
Visa at ~28x P/E vs a 10-year average of ~34x. Mastercard at ~30x vs a 5-year average of ~38x. Both growing double digits. Buffett holds $4.9B combined and has not sold. The selloff looks like panic, not fundamentals. Full breakdown linked in comments.
There is a lot more to this story.
The full valuation breakdown, the AI agent payment threat, how the EU Wero system actually works, and whether Buffett's position changes the thesis. All of it is covered in the full article linked in the comments. Worth the read.
India proved governments can kill card networks. Is the EU next or too slow to pull it off?
$PLTR Q1 numbers were massive.
• Revenue: $1.63B (+85% YoY)
• Adj. EPS: $0.33 (+150%)
• US business: $1.28B and more than doubled in 12 months
Government demand keeps accelerating across the Pentagon, DHS, USDA, and more, while commercial growth is exploding too.
Last quarter alone:
• 206 deals over $1M
• 72 deals over $5M
• 47 deals over $10M
Management also raised full-year revenue guidance to $7.65B–$7.66B.
Even after beating on nearly every metric, the stock dipped after earnings as investors questioned valuation.
But the fundamentals are getting harder to ignore.
$PLTR

94
$RBLX dropped ~21% , not from fraud or a hack, but from adding age verification.
Roblox restricted chat for users who didn’t complete age checks → engagement took a hit.
Q1:
- DAUs +35% (vs ~44% expected)
- Bookings guidance cut to 8–12% (from 22–26%)
Stock fell from ~$57 to low-$40s.
Roblox said growth was “tempered” by the rollout. Makes sense, the platform is social at its core.
Context:
- Ongoing child safety pressure → this was the response
- TD Cowen: upgraded to Hold, says guidance is now more realistic
Long term: could improve the ecosystem
Short term: clear pain
Is this a buy-the-dip moment or does this break what made Roblox work?
🤖 Made with AI

1
335
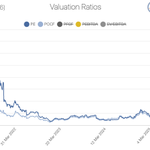
$TSLA valuation is moving up again, are expectations creeping back in?
$TSLA multiples have been climbing again recently:
Trailing P/E: ~370x
Price to FCF: ~225x
EV/EBITDA: ~120x
Price/Sales: ~15x
Price/Book: ~17x
If you zoom out, this pattern looks familiar.
Valuation compressed hard from 2021 → 2023, then started rising again into 2025–2026.
But here’s the key part:
Multiples are expanding again, while growth is there (~35% EPS), but not at a pace that fully explains how high these valuations are.
So the market is clearly pricing something ahead.
Likely expectations:
- Autonomy / robotaxi
-Long-term margin expansion
-New product cycles beyond cars
At the same time, $TSLA is still trading at a very different level compared to most large caps.
So what’s the market really betting on here?
Is this being driven more by actual growth…
or expectations getting priced in again?


1
74

Nvidia's return on invested capital is 72%. Free cash flow is $96 billion on $6 billion of capex. The stock is 10% off its highs.
Pulled the full numbers from iOCharts this week because I wanted to form an actual view rather than just following the narrative.
The business numbers first.
- Free cash flow: $96.68 billion TTM.
- Capex: $6.04 billion.
- Operating margin: 60.38%.
- Profit margin: 55.60%.
- Return on invested capital: 72.27%.
- Return on equity: 76.33%.
- EPS growth 5-year: 95.40% annually.
That capex to free cash flow ratio is the thing I keep coming back to. $6 billion spent. $96 billion generated. In a hardware business.
The valuation metrics, this is where valuation comes in:
- Price: $184.97
- All-time high: $207.04 (~10% below)
- Trailing P/E: 40.82x
- Forward P/E: 25.67x
- Price to free cash flow: 50.69x
- Analyst target: $268.22 (~45% upside)
Historically, Nvidia’s average drawdown from highs is ~36.65%.
Right now it’s only ~10.66%.
Average time to recover to a new high: 19 days
Worst case: 2,158 days
What the historical data shows: average drawdown from highs across Nvidia's history is 36.65%. Currently only at 10.66%. Average time to recover to new high is 19 days but the worst case was 2,158 days.
1-year return: +79.75%. 3-year CAGR: +96.71%. 5-year CAGR: +67.69%.
Full numbers here if you want to look yourself: iocharts.io/stocks/NVDA
The business case is hard to argue with. 50x free cash flow on a stock only 10% off its highs is a different conversation.
Best business quality in the market or just the most expensive one right now?
23
The world's largest stocks ranked by market cap - plus their dividend yields
The top 10 stocks right now are worth roughly ~$25–26T combined, which is kind of insane when you put it together.
Breakdown:
$NVDA — ~$4.5T (0.02%)
$AAPL — ~$3.8T (0.40%)
$GOOGL — ~$3.8T (~0.3%)
$MSFT — ~$2.7T (~0.9%)
$AMZN — ~$2.5T (no dividend)
$TSM — ~$1.9T (~1.0%)
$AVGO — ~$1.7T (~0.7%)
$Saudi Aramco — ~$1.7T (~3–4%)
$META — ~$1.5T (~0.3%)
$TSLA — ~$1.3T (no dividend)
What stands out is how little income most of this $25T actually generates.
Outside of a few names, you’re basically not getting paid to hold these, it’s all about growth, AI, and future expectations.
When you stack them together like this, it really feels like the top of the market is one big growth trade.
Been comparing this group with more dividend-heavy stocks and the difference is pretty clear.
How are you guys thinking about this?
Just ride the large-cap growth wave, or balance it out with income plays?

123
$TSLA trailing P/E is 406x. Forward P/E is 146x. The stock is still 16% below its all-time high.
I've been going through Tesla's full data this week and a few things stand out that aren't getting much attention.
The valuation numbers first because they're the ones that generate the most debate. Trailing P/E sits at 406x. Forward P/E at 146x. Price to sales 16.25x. EV/EBITDA 134x. These are not cheap multiples by any traditional measure.
But then you look at what the business actually generated. Revenue TTM $94.83 billion. Gross profit $17.09 billion. Operating cash flow $14.75 billion. Free cash flow $6.22 billion. Net income $3.79 billion. The business is real and generating real cash.
The delivery chart is where things get interesting. Quarterly deliveries peaked somewhere around 495,000 in late 2024, then started declining. Q1 2026 came in at 358,023, missing estimates of 366,000 to 370,000. The chart shows a clear sequential decline from the record quarter.
The segment gross margin chart shows something most people miss. Automotive margins have been compressing since their peak above 30% in 2022. Energy generation and storage margins have been climbing and are now approaching automotive margins. Those two lines are converging.
The balance sheet shows $137.81 billion in total assets against $54.94 billion in total liabilities. Shareholder equity $82.86 billion. Cash on hand $16.51 billion.
The price data: all-time high $489.88. Current price $423.60. Down 16.18% from that high. JPMorgan price target $145. Average analyst target $420.90.
The 10-year CAGR is 45.19%. The 5-year CAGR is 7.72%. That gap between the two numbers tells you almost everything about what the past 5 years have actually delivered versus the decade before.
We track all of this on iOCharts including delivery trends, segment margins, valuation history and cash flow trajectory in one place: iocharts.io/stocks/TSLA
406x trailing P/E. $6.22B free cash flow. Deliveries declining from peak. Energy margins closing in on automotive.
Which number do you think actually matters most for where this stock goes from here?


64
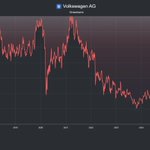
Volkswagen ( $VOW3 ) stock is down 65% from its highs. P/E of 6.4x.
The first thing most investors think when they see a stock down 65% from its highs is that it must be cheap.
VW at €87.30 today. Down 63.8% over the past five years. P/E of just 6.4x. EV/EBITDA of 10x. On the surface it looks like a classic value play.
But here's what the underlying numbers actually show.
2025 was VW's worst year since the diesel scandal in 2016. Net profit fell to €7.3 billion from €11.3 billion the prior year, a 35% decline. Sales stagnated at around €260 billion, down 2.3%. Operating margin collapsed from 6.7% to 4.1%. US tariffs alone added a €1.4 billion burden to the group.
The segment breakdown makes it worse. Porsche, historically the group's most profitable division, saw operating profit fall from over €5 billion to just €90 million in 2025. Operating margin at Porsche dropped to 2% from 14.3% the year before. Net income at Porsche: €431 million down from €3.59 billion.
The structural numbers are the part that doesn't recover quickly. VW's Return on Invested Capital has historically run at 5-8%, well below the standard cost of capital threshold of 10%. That means the company has been structurally destroying value, not creating it, for years. With the 2025 earnings deterioration that number has fallen further to 1.7%.
The debt picture: total debt reached €264.7 billion in December 2025. Cash and equivalents: €38.8 billion. That gap has been growing consistently since 2016.
The competitive picture: China used to account for 35-40% of VW's global sales. That share is steadily declining as BYD, Geely and SAIC take domestic market share. BYD grew 7.7% in 2025. Geely grew 23.4%. VW's global sales fell 0.5% to 8.68 million units.
Management is targeting a slightly improving operating margin in 2026 which could bring operating profit to around €13-18 billion. The plan to cut 50,000 jobs is generating conflict with the IG Metall union. German labor laws mean the restructuring will be slower and more expensive than announced.
The stock tried to recover multiple times during 2025 near the €100-110 level. Each time it fell back. The 50,000 job cut announcement in early 2026 caused a brief positive reaction. It did not hold above €100 permanently.
We published the full VW analysis on the iOCharts blog with every metric broken down including ROIC, ROCE, debt trajectory, Porsche segment deep dive, and the ownership structure between VW, Porsche Holding Stuttgart, and Porsche SE.
VW at 6.4x P/E with 65% drawdown, structural ROIC below cost of capital, and China market share in structural decline.
Classic value trap or genuinely beaten down to a real entry point?

88
Samsung just dropped ~13% in 5 days after a ~190% run…
while the business is arguably stronger than ever.
Here’s what’s going on ↓
They’re:
Supplying HBM3E for $AMD AI GPUs
Moving toward HBM4 for next-gen accelerators
Still a secondary HBM supplier to $NVDA (not leading, but present)
And they’re not slowing down:
~$70B+ semiconductor investment planned through the decade
This is expansion, not hesitation
Zoom out and the structure is clear:
$NVDA / $AMD → AI compute
$TSM → leading-edge manufacturing
Samsung Electronics → memory + pushing into foundry
And the key bottleneck:
HBM (high-bandwidth memory)
AI doesn’t scale without it, and supply is still tight
So what changed?
Not the story. The expectations.
After a ~190% run, the market is asking:
- Is HBM growth already priced in?
-Can Samsung close the gap with SK Hynix?
- How much execution risk is still left?
This looks more like a reset than a broken thesis.
But now valuation meets reality.
Buying, holding, or trimming?
In stocks copying a competitor takes years. In DeFi it takes 5 minutes. Here's what that means for every DeFi token you own.
Every DeFi smart contract is open source and publicly readable. Anyone can copy the entire codebase of the market leading exchange and launch a working clone before lunch. Zero development cost. Zero R&D time.
This actually happened to Uniswap. SushiSwap copied the code exactly, launched with aggressive token incentives, and pulled significant liquidity away within days. The attack worked well enough to establish SushiSwap as a real competitor.
This means the traditional concept of a software moat doesn't exist in DeFi. The only real competitive advantage is network effect. The trust, liquidity, and brand recognition that accumulates over time and genuinely cannot be copy-pasted alongside the code.
When evaluating any DeFi protocol the most important question is not how good the technology is. It's how deep the network effect is and how long it would take a well-funded clone to replicate it.
This is one concept from our full guide on crypto fundamental analysis where we break down every major category with the specific metrics that actually matter.
👉 Do you think network effect is enough of a moat to protect the leading DeFi protocols long term or is everything vulnerable to a well-funded fork?
1
33

You wouldn't buy a stock without checking the financials. Why are you buying crypto differently?
Crypto has real revenue now. Aave earns interest spreads. Uniswap collects trading fees. Ethereum burns tokens against real usage.
The data is public, on chain, and visible in real time. No waiting for quarterly reports.
The problem is most investors don't know which metrics actually matter. TVL means something different than bank deposits. FDV is not the same as market cap. Token inflation works exactly like share dilution but most people never check it.
We wrote a complete framework breaking down how to analyze every major crypto category properly. Layer 1s, DeFi, DePIN, RWA, Oracles, GameFi. Each one needs a completely different approach.
Full guide here: iocharts.io/en/blog/kripto-f…
Which crypto category do you find hardest to evaluate?

1
34
Amazon. Alphabet. Meta. Oracle. They’re all borrowing tens of billions at the same time.
This isn’t one company making an unusual financing decision.
It’s a pattern.
$GOOGL (Alphabet) recently raised about $32B in the bond market.
$ORCL (Oracle) has also raised tens of billions to fund cloud and AI infrastructure.
$META (Meta) raised roughly $30B in October, one of the largest bond sales ever by a tech company.
Now $AMZN (Amazon) has launched a $37–42B offering, which could rank among the largest corporate bond deals ever, second only to Verizon’s $49B deal in 2013.
The reason is sitting in that spending chart.
In 2018, the major hyperscalers combined spent roughly $50B on capital expenditure.
That number climbed steadily through 2022 and 2023, then jumped sharply in 2024, and again in 2025.
In 2026, the combined forecast is around $650B for the largest hyperscalers.
The spending surge is accelerating much faster than in previous years.
$AMZN alone is expected to spend roughly $200B this year on data centers, chips, and infrastructure, one of the largest corporate capital investment programs ever.
Internal cash flows fund part of it.
Bond markets fund the rest.
Investor demand for Amazon’s deal reportedly ran several times the offering size, showing strong appetite from bond buyers. Some tranches reportedly extend decades into the future, showing investors willing to lend long term.
The timing is also notable. Bond markets had slowed sharply after geopolitical tensions in the Middle East. When the window reopened, $AMZN moved quickly.
Does ~$650B in hyperscaler spending change where the real infrastructure bet is?

1
92
The AI Chip Supply Chain: Why TSMC Might Matter More Than NVIDIA
As AI spending grows from $500B to $1.4T by 2030 (per Ark Invest), who captures the value?
While everyone debates NVIDIA vs AMD vs custom AI chips, TSMC manufactures ALL of them:
- NVIDIA GPUs (TSMC's #1 customer as of 2026, overtaking Apple)
- AI ASICs from Broadcom, Google, Amazon
- Apple chips for iPhones and Macs
- AMD CPUs and GPUs
This is a "picks and shovels" play - they win regardless of which chip architecture dominates AI workloads.
- Market cap: $2T
- Stock: $374.58
- TSMC's AI revenue growth target: mid-to-high 50% CAGR through 2029
- 2026 capex: $52-56B (up 27-37% from 2025's $41B)
Near-monopoly on advanced chip manufacturing:
- Intel's foundry bleeding cash, struggling with yields
- Samsung pivoting focus to memory chips
- No other players at leading-edge nodes (3nm, 2nm)
TSMC reportedly gave customers a 4-year price increase roadmap. That's pricing power.
Risk vs Reward:
- Forward P/E: 24x
- PEG ratio: 0.7 (suggests undervalued relative to growth)
- BUT Simply Wall St model says 28.5% overvalued
- One concern: high non-cash earnings
Arizona Impact: Apple's order for US-made chips is significant:
- Reduces Taiwan geopolitical concentration
- Aligns with government policy push
- Could attract more customers wanting domestic supply
If AI data center spending really triples to $1.4T by 2030, TSMC captures a chunk of that regardless of:
- Whether GPUs or ASICs dominate
- Whether NVIDIA maintains market share
- Which cloud provider wins
Is this a better risk-adjusted AI play than betting on individual chip designers?
Portfolio Consideration:
- Direct chip stocks (NVDA, AMD): higher upside, higher risk
- Foundry (TSMC): broader exposure, lower volatility?
- Equipment (ASML): even further upstream
Where do you allocate semiconductor exposure?

Novo Nordisk lost 16% in a single day this week while Eli Lilly popped 4.6% on the SAME morning. The GLP-1 war has a winner and it's not who started it.
The timing of what happened earlier this week was savage.
Novo's comeback drug CagriSema failed to prove it was even equal to Lilly's tirzepatide after 84 weeks. 23% weight loss vs 25.5%. That gap sent $NVO to its lowest price since June 2021 while $LLY went up on the same day after launching a new Zepbound product.
$NVO is down nearly 50% over the past year, guiding negative for 2026. $LLY guiding 25% growth and still on offense.
The problems stack up beyond just this trial. Compounding pharmacies undercutting on price, losing exclusivity in key markets, Jefferies flagging a potential $35 billion M&A need just to patch the pipeline. CEO still believes in higher dose CagriSema trials and an FDA decision is expected late 2026, so it's not completely dead.
But Lilly's GLP-1 pill is coming Q2 2026 too.
Buying the $NVO dip or is $LLY the only name worth holding in this space? Let's hear it.
Also wrote a article on this one, link in the comments.
1
5
83
