

Expore . Learn . Achieve
- Tweets326
- Following2
- Followers52
- Likes9






ALT Synthetic ML portfolio example with 100 cases: 95 negatives and five positives. A baseline predicts negative for every case. The confusion matrix has 95 true negatives, zero false positives, five false negatives and zero true positives. Accuracy is 95/100, or 95%; positive recall is 0/5, or 0%. Show class counts and the confusion matrix alongside the score. Conceptual illustration, not a product result. Official LDS logo, Let's Data Science and letsdatascience.com appear in the footer.

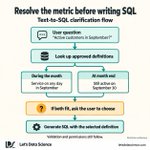
ALT Text-to-SQL flow: look up approved definitions for active customers in September. Service on any day in the month and still active on September 30 are different definitions. If both fit, ask the user to choose, then generate SQL with the selected definition. Validation and permissions still follow. Includes the official LDS logo, Let's Data Science and letsdatascience.com.


ALT Comparison of one order row with two joined item rows. Order 101 totals $100. Joining to items A and B repeats $100 in both rows, so a naive sum gives $200. Calculate order revenue at one row per order. The illustrative graphic includes the official LDS symbol, Let's Data Science and letsdatascience.com.

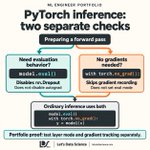
ALT Decision map for a PyTorch forward pass. Two independent checks lead to model.eval(), which disables nn.Dropout but does not disable autograd, and torch.no_grad(), which skips gradient recording but does not set eval mode. The branches join at a three-line example using both before y = model(x). A portfolio takeaway asks for separate tests of layer mode and gradient tracking. The official LDS symbol, Let's Data Science and letsdatascience.com appear in the footer.


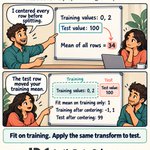
ALT Two-panel comic illustrating ML preprocessing leakage. A practitioner centers all rows before splitting: training values 0 and 2 plus test value 100 give mean 34. A colleague separates the test row and fits mean 1 on training only. Subtracting that mean gives training values -1 and 1, and test value 99. The takeaway is to fit on training and apply the same transform to test. Official LDS logo, Let's Data Science and letsdatascience.com appear below.

ALT One pre-normalized transformer residual branch, using illustrative values. Input x=[2,-1] splits: a teal skip path keeps x; an orange path runs through LayerNorm and a sublayer to give update=[0.5,0.25]. Addition gives y=[2.5,-0.75]. The equation is y=x+Sublayer(LayerNorm(x)). If the update is zero, y=x. This is one branch, not a full block. The official LDS symbol, Let's Data Science and letsdatascience.com appear below.


ALT Illustrative three-token temperature example with a fixed model and prefix and no top-k or top-p filter. At T=1, A, B and C have probabilities 60.0%, 30.0% and 10.0%. At T=0.5 they become 78.3%, 19.6% and 2.2%, rounded. Square the original probabilities and normalize: [0.36, 0.09, 0.01] / 0.46. The top token is more likely, not guaranteed. This does not measure factual accuracy. Official LDS logo, Let's Data Science and letsdatascience.com appear below.

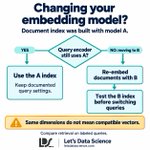
ALT Decision map for changing an embedding model. Documents are indexed with model A. If queries still use A, use the A index with its documented query settings. If moving to B, re-embed documents with B and test the B index before switching queries. Equal dimensions do not mean compatible vectors. Compare retrieval on labeled queries. Official LDS symbol, Let's Data Science and letsdatascience.com appear in the footer.


ALT Illustrative decoder attention example at query position 2 of 3. Replacing the future score with zero leaves scores [0, 0, 0] and weights [1/3, 1/3, 1/3]. Masking before softmax gives scores [0, 0, negative infinity] and weights [1/2, 1/2, 0]. exp(0) is 1; exp(negative infinity) is 0. Before dropout, check that future weight is zero and the row sums to one. Official LDS symbol, Let's Data Science and letsdatascience.com appear in the footer.

ALT Decision map for a model with a configured chat template. Need formatted text first? No: use apply_chat_template with tokenize=True and use its token IDs. Yes: use tokenize=False, then tokenize the formatted chat with add_special_tokens=False. The template already supplies special tokens; adding them again can duplicate them. Official LDS symbol, Let's Data Science and letsdatascience.com appear in the footer.


ALT Python challenge with illustrative data. Products columns: product_id, product_name, category, price. Rows: 101 Lamp Home 30; 102 Mug Home 12; 103 Mat Home 20; 104 Clock Home 25. Order items pairs (order_item_id, product_id): (1,101), (2,101), (3,103). Return products with no matching order items, keep all four product columns, sort by product_id ascending and reset the index. Official LDS symbol, Let's Data Science and letsdatascience.com appear in the footer.

ALT Illustrative conditional probability table of 100 support tickets. Priority: 12 escalated, 8 not escalated, total 20. Not priority: 28 escalated, 52 not escalated, total 80. Column totals: 40 escalated and 60 not escalated. Among priority tickets, P(escalated | priority) = 12/20 = 60%. Among escalated tickets, P(priority | escalated) = 12/40 = 30%. The condition chooses the denominator. Official LDS symbol, Let's Data Science and letsdatascience.com appear in the footer.
