
Keep it simple 💊| Tweets are not financial advice or by an economist| Buy Me A Coffee https://teapaw.org/t.co/7msvik4ZTn|
Planet Earth
Joined November 2022
- Tweets4.6K
- Following193
- Followers16.7K
- Likes9.8K





Macro Dose retweeted
US CPI Breakdown⚠️
Headline CPI advanced 0.39% (Prev. 0.3%) in December, significantly affected by a surge in energy prices. On a year over year basis CPI rose 2.9% (Prev. 2.7%), as expected, and is at its highest since July after rising for the third consecutive month.
Core CPI, which is a preferred metric as it excludes more volatile energy and food components, was up 0.23% on the month. Core is now up 3.2% year over year (Prev. 3.3%), better than consensus estimates of 3.3%.
There have been some that have noted that the core CPI YoY figure untruncated is 3.248%, less than 0.003% off coming in at a rounded 3.3%. However, when using year over year figures the BLS tends to report unadjusted indexes as there is no need for seasonal adjustment when comparing the same month a year earlier. When using the unadjusted 12 month index we arrive at 3.238%.
Certainly, the Fed will be relieved to see core CPI coming in lower than the 0.3% reported for the prior 4 months. However, as can be seen below, 3 month and 6 month annualized figures for both core and headline CPI remain elevated well above the Fed’s target.
3 month annualized
Core 3.3% (Prev. 3.7%)
Headline 3.9% (Prev. 3%)
6 month annualized
Core 3.2% (Prev. 2.9%)
Headline 3% (Prev. 2.1%)
Annualized figures are the rate at which year over year inflation would print at if the defined time period's pace was maintained for 12 months. It allows for a visualization of inflation momentum.
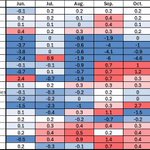
Medical care services cooled, as did core goods, which had a hotter than anticipated print in November. See below, US CPI heatmap.
It is worth noting that the number of components in the detailed categories data of the US CPI clocking in at a month over month rate that annualizes to 3.7% or higher (0.3% MoM) has increased over the last 2 months. Infact, over 45% of the items in the US CPI still meet this criteria, suggesting the breadth of inflation in the US is still notable.
Overall
The print will likely be seen as a sign of progress from the Fed. However, as Powell repeatedly iterates, this is one data point and the Fed do not act based off of single data points.
Furthermore, anyone that is a long term Macro Dose reader will know that the PCE price index is the Federal Reserve’s favored inflation measure and is released later in the month.
Following the report, CME FedWatch has a January Fed pause as a near certainty and March as a >70% probability. May is now priced in as a coin toss.
Simply explained
Released by the Bureau of Labor Statistics monthly
The Consumer Price Index measures the change in prices for goods and services for urban consumers; it is a measure of inflation. To achieve this, a basket of goods and services prices is sampled monthly. The goods and services in question are supposed to reflect the spending patterns of consumers in the United States. The data is supposed to be representative of prices for over 90% of the US population.

Macro Dose retweeted

❤️ Over the next few days, you’ll see many people sharing their highlights of 2024.
It’s okay if your greatest achievement this year was simply making it through.
That alone is something to be proud of, especially if you’ve faced challenges with your mental health.
Remember, you are a f*cking legend.

Macro Dose retweeted
POWELL SPEECH SUMMARY⚠️
1. Decided to lower interest rate by 25bps to 4 ¼ - 4 ½%. Have lowered policy rate by 1% from peak and substantially reduced restrictiveness. Can now afford to be more cautious with rate cuts. Today’s decision to cut was a closer call (one dissent). Compared increased levels of uncertainty to walking in the dark or driving on a foggy night and choosing to slow down to be more careful.
2. Powell states Fed are in a new phase in the process of their cutting cycle; they are now closer to but not at neutral rate (R*). Powell believes the Fed are still meaningfully restrictive. Going forward they are going to be moving more slowly but Powell believes Fed policy remains restrictive.
Context: neutral rate is the interest rate that neither stimulates or restricts the economy too much and essentially achieves the Fed’s dual mandate goals. Powell noted that there are many difficult models for trying to calculate this and they all give widely varying answers. Essentially no one knows for certain what this rate is and the Fed are trying to navigate towards it.
3. Powell was asked why the Fed would be cutting if inflation only falls from 2.8% to 2.4% in 2025, as projected in todays SEP. He stated that this would still be meaningful progress towards goal and they also need to keep an eye on the cooling of the labor market. Powell refuted the idea that was suggested to him that the wording in the Fed’s statement could reasonably be believed to indicate that this could be the last cut for a while.
4. The US economy is performing exceptionally well in comparison to global peers and has cooled from being overheated. Powell feels the outlook is pretty bright for the US economy and 2025 will be a good year. Growth is stronger than expected, spending is resilient although the housing sector is weak. FOMC members feel downside risks are less.
5. Inflation still somewhat elevated and have more work to do but longer-term inflation expectations remain well anchored. The Fed have increased inflation expectations in current SEP in response to higher-than-expected inflation readings and associated higher Federal Funds Rate projections reflect this (3.9% 2025 and 3.4% 2026). Inflation might take another year or two to get to target but Powell confident the Fed will get there.
6. The US labor market is cooling but Powell emphasised that this is at a gradual pace and stated that much of the downside risk has diminished. The unemployment rate is higher than it was but remains low. People are not losing their jobs are abnormal rates but hiring has slowed and it is harder to find a job. Labor market conditions are now less tight than immediately pre-pandemic and no longer causing inflationary impulse in economy.
7. Asked about Trump tariffs: Stated some people at the meeting took this into account and some didn’t. Powell was asked whether it would be appropriate to look through inflation figures if they were to be once off increases because of tariffs. Powell was cautious with commenting on this and emphasized the level of uncertainty around future policies. However, he did note that it might be appropriate to do so in the case of once off increases but this is being considered by the Fed. The Fed are trying to consider how new fiscal policies might affect inflation as they prepare for when they do actually see the new policies of the incoming Trump government.
8. Powell was asked about a strategic Bitcoin reserve. He stated that the Fed are not allowed to hold Bitcoin and are not seeking for a change to the law around this.
Macro Dose retweeted

UK companies cut #jobs at the fastest rate in nearly 4 years in December amid slowing demand and rising employment costs. #UK Flash #PMI remains at 50.5 (Nov: 50.5).
Find out more: okt.to/9mA6Bz #economy #services #manufacturing

Macro Dose retweeted
THE WEEK AHEAD⚠️
A week packed with central bank rate decisions 🇺🇲🇬🇧🇯🇵
Monday
00:30 🇯🇵 Jibun Bank PMIs (Dec)
01:30 🇨🇳 House Price Index (Nov)
02:00 🇨🇳 Retail Sales (Nov)
02:00 🇨🇳 Industrial Production (Nov)
02:00 🇨🇳 Unemployment Rate (Nov)
07:00 🇪🇺 ECB Lagarde Speech
08:15 🇫🇷 HCOB PMIs Flash (Dec)
08:30 🇩🇪 HCOB PMIs Flash (Dec)
09:00 🇪🇺 HCOB PMIs Flash (Dec)
09:30 🇬🇧 S&P PMIs Flash (Dec)
13:30 🇺🇲 Empire State Mfg Index (Dec)
14:45 🇺🇲 S&P PMIs Flash (Dec)⚠️
Tuesday
07:00 🇬🇧 Unemployment Rate (Oct)
07:00 🇬🇧 Average Earnings (Oct)
07:00 🇬🇧 Claimant Count Chnge (Nov)
07:00 🇬🇧 HMRC Payrolls (Nov)
09:00 🇩🇪 IFO Business Climate (Dec)
10:00 🇪🇺 Balance of Trade (Oct)
10:00 🇩🇪 ZEW Econ Sentiment (Dec)
13:30 🇨🇦 Canada CPI (Nov)
13:30 🇺🇲 Retail Sales (Nov) ⚠️
14:15 🇺🇲 Industrial Production (Nov)
15:00 🇺🇲 Business Inventories (Oct)
15:00 🇺🇲 NAHB Housing Mkt Idx (Dec)
18:00 🇺🇲 20 Year Bond Auction
23:30 🇦🇺 Wstpc Cnsmr Cnfdnce (Dec)
23:50 🇯🇵 Balance of Trade (Nov)
Wednesday
07:00 🇬🇧 UK CPI (Nov)⚠️
07:00 🇬🇧 UK PPI (Nov)
11:00 🇬🇧 CBI Industrial Trends (Dec)
12:00 🇺🇲 MBA Mortgage Apps
13:30 🇺🇲 Building Permits (Nov)
13:30 🇺🇲 Housing Starts (Nov)
19:00 🇺🇲 FED RATES DECISION ⚠️
Thursday
03:00 🇯🇵 BOJ RATES DECISION ⚠️
07:00 🇩🇪 Gfk Consmer Confdnce (Jan)
12:00 🇬🇧 BOE RATES DECISION ⚠️
13:30 🇺🇲 GDP Growth Final (Q3)
13:30 🇺🇲 Jobless Claims
13:30 🇺🇲 Philly Fed Mfg Index (Dec)
15:00 🇺🇲 Existing Home Sales (Nov) ⚠️
15:00 🇺🇲 CB Leading index (Nov)
21:30 🇺🇲 Fed Balance Sheet
23:30 🇯🇵 Japan CPI (Nov)
Friday
01:15 🇨🇳 Loan Prime Rate 1Y+5Y
07:00 🇩🇪 German PPI (Nov)
07:00 🇬🇧 Retail Sales (Nov)
11:00 🇬🇧 CBI Distributive Trades (Dec)
13:30 🇨🇦 Retail Sales (Oct)
13:30 🇺🇲 PCE Price Index (Nov)⚠️
13:30 🇺🇲 Personal Spending (Nov)
13:30 🇺🇲 Personal Income (Nov)
15:00 🇪🇺 Consumer Confidence (Dec)
15:00 🇺🇲 UM Consmer Cnfdnce F(Dec)
Times above in GMT ⌚
Macro Dose retweeted
US CPI SUMMARY⚠️
Whatever way you want to look at it, inflation progress as measured by CPI seems to have stalled. 3 month annualized rates for both core and headline inflation are well above the 2% target (and rising) and 6 month annualized readings are also picking up.
Was today’s CPI report enough to make the Fed pause? No, there were no major shocks on the day. However, they very much will be aware inflation may not be on an entirely smooth path towards 2%. This is something Powell has stated he expected to be the case to be fair.
Following today's CPI, CME FedWatch has a >98% probability of a 0.25% further cut at their meeting this month.
Headline CPI advanced 0.31% (Prev. 0.2%) in November. On a year over year basis CPI rose 2.7% (Prev. 2.6%), as expected and is at its highest since July. This is the second consecutive increase in YoY CPI.
Core CPI, which excludes more volatile energy and food, was up 0.31%. Core is up 3.3% year over year (Prev. 3.3%), in line with expectation.
3 month annualized
Core 3.7% (Prev. 3.6%)
Headline 3% (Prev. 2.5%)
6 month annualized
Core 2.9% (Prev. 2.6%)
Headline 2.1% (Prev. 1.4%)
Annualized figures are the rate at which year over year inflation would print at if the defined time period's pace was maintained for 12 months. It allows for a visualization of inflation momentum.
Overall
The rate of change seen in the last 3 months of both core and headline CPI is running well above the Fed's target.
Shelter rose 0.3% (Prev. 0.4%), which made up almost 40% of the total monthly CPI rise. This is part of CPI that Powell has said the Fed are relatively confident will cool as leases roll over. Owners equivalent rent actually advanced at the coolest pace since 1H 21. Lodging away from home advanced rapidly at 3.2% month over month and was an outlier.
New vehicles, as well as used cars and trucks advanced at a rapid pace, 0.6% and 2% month over month respectively, but remain in year over year deflation.
Core goods, which for most of the year has seen deflation, rose at 0.3%.
Having said all the above, we know core PCE is the Fed's preferred measure of inflation. It is generally more dynamic to consumer spending and places less of an emphasis on shelter than CPI.
US CPI Heatmap
Simply explained
Released by the Bureau of Labor Statistics monthly
The Consumer Price Index measures the change in prices for goods and services for urban consumers; it is a measure of inflation. To achieve this, a basket of goods and services prices is sampled monthly. The goods and services in question are supposed to reflect the spending patterns of consumers in the United States. The data is supposed to be representative of prices for over 90% of the US population.

Macro Dose retweeted
Labor Market Week ⚠️
So far
1. JOLTS (Oct): US Job openings were up, well above consensus. Longer term trend remains that of cooling vacancies. The hires rate fell month on month and in general is at levels which are historically low, may have been impacted by hurricanes. The quits rate rose, suggesting an improvement in workers' confidence in their ability to find new jobs. Layoffs remain low.
2. ADP Employment Change (Nov): Slightly below consensus, job gains in private sector slowed from prior month but remain respectable. October’s blowout print was revised significantly lower. Large companies added the most jobs while small businesses shed staff. Manufacturing weakest while services sector accounted for majority of jobs added. First uptick in median YoY wage growth for job changers since March and first for those staying at their job since Sept 2022.
3. Challenger Job Cuts (Thurs)
4. Jobless Claims (Thurs)
5. Nonfarms et al (Fri)
Macro Dose retweeted
PCE Price Index⚠️
Month over month
PCE 0.2% (Exp. 0.2%, Prev. 0.1%)
Core 0.3% (Exp. 0.3%, Prev. 0.2%)
Core PCE, the Fed's favoured measure of inflation, came in at a month over month rate of 0.3%. This month's rise in core PCE prices would be in keeping with a 12 month rate of over 3% and was the highest since April this year.
Core PCE excludes more volatile categories like food and energy to give a better picture of underlying inflationary pressures in the economy
Despite the rate of core inflation picking up, 1 month doesn't make a trend, as the Fed often point out. The 6 month and 3 month annualized rates are well within earshot of the Fed's 2% target. However, The Fed will still be keeping a close eye as they plan the pace of their rate cutting cycle.
A reacceleration in monthly pace was seen in multiple areas. This can be seen in the below heat map of September's PCE.
Simply Explained
The Personal Consumption Expenditures price index is measure of consumer price inflation, like CPI. However, PCE is more dynamic and changes in line with consumer spending patterns. E.g. if consumers swap spending on one item for another then the PCE will reflect this; CPI is less responsive to consumer behaviour changes.
On top of this, PCE reflects urban and rural inflation whilst CPI focusses on urban consumers. PCE is also measured by data provided by businesses, while CPI is based on consumer survey responses.
Annualized readings display the year over year rate at which inflation would advance if the rate it changed at in the defined time period (e.g. 3 month/6 month) was maintained for a whole year.


Macro Dose retweeted
JOLTS BREAKDOWN⚠️
Job Openings
1. Job openings in the Job Openings and Labor Turnover Survey (JOLTS) decreased to 7.443 million (Exp. 7.8M, Prev. 7.861M), substantially worse than expected in September. The trend of declining job openings continued in the US. The month over month decline was the largest since March and the number reflects the lowest openings since January 2021.
We are rapidly approaching pre-pandemic levels of job openings as the labor market loosens from the post-pandemic high seen in March 22 at 12.2 million. The figure reported for August, which was seen as a significant beat at the time, was also revised lower from 8.04M.
-----------------------------------------
Unemployed persons vs job openings
2. The number of unemployed people per job opening ratio remained at 0.9. This is well below the historical median seen since 2000 but has been increasing as the labor market loosens.
This ratio compares the number of people that are currently out of work and looking for work to the number of current available jobs. Thus, an increasing number suggests a loosening labor market as there are more unemployed people competing for the jobs available to them. This is a closely monitored ratio by the Federal Reserve when assessing labor market dynamics.
-----------------------------------------
Quits
3. The quits rate fell slightly to 1.9% (Prev. 2.0%). This is below the pre-pandemic level of 2.3% and just below the median seen since 2000. It remains in an observable downtrend and is the lowest reading for quits since June 2020.
The quits rate tracks the proportion of people leaving their job voluntarily. People tend to leave of their own accord when they have a better offer/another job lined up. Decreasing quits suggest that people are finding it harder to find new/better jobs or are less confident of finding one if they were to leave their current post.
-----------------------------------------
Hires
4. The JOLTS hires rate crept up to 3.5% (Prev. 3.4%). suggesting hiring increased slightly in the US. The US labor market is still running well below the 3.8% median hires rate seen in JOLTS since 2000. Hiring remains in a clear downtrend as the labor market continues to cool and companies slow their onboarding processes.
The hires rate records the % of hires relative to current number of employees in any given month and essentially portrays how keen employers are to onboard new employees.
-----------------------------------------
Layoffs
5. Layoffs (people involuntarily leaving their jobs) remains low but ticked up to 1.2% (Prev. 1.0%). This remains marginally below the historical median layoffs level seen since 2000 of 1.3%. We are yet to see a substantial spike in layoffs in JOLTS data.
-----------------------------------------
Overall
Job openings continue their downtrend as we approach near pre-pandemic levels. The hires rate did tick up, indicating an increase in hiring, which was relatively broad-based across sectors.
However, the number of layoffs ticked up, and less people left their job voluntarily, indicating it is becoming more difficult to find another job once you are unemployed in the US.
While JOLTS is vulnerable to fluctuation due to response rates the direction of travel is clear and displays a loosening of the US labor market.
-----------------------------------------
JOLTS Simply explained
Released monthly, the Job Openings and Labor Turnover Survey (JOLTS) is a collation of responses to a random sample of approximately 21,000 nonfarm business and government establishments in the United States, enquiring about current employment conditions in the US. It gives vital insight into the supply and demand dynamics of the US labor market. However, it is backwards looking as the release looks back at the last business day of the prior month.
The JOLTS survey response rate has plummeted from pre-pandemic and has also become a significant limitation of the release.


Macro Dose retweeted
The Week Ahead⚠️
Well, I'm not sure I've seen a more packed week ahead since I started posting on Twitter...
There is going to be a lot of data to digest this week.
Monday
11:00 🇬🇧 CBI Industrial Trades (Oct)
14:30 🇺🇲 Dallas Fed Mfg Index (Oct)
15:30 🇺🇲 2-Year Note Auction
17:00 🇺🇲 5-Year Note Auction
19:00 🇺🇲 Treasury Refunding Est
Tuesday
07:00 🇩🇪 Gfk Consmer Confdnce (Nov)
09:30 🇬🇧 UK Consumer Credit (Sep)
09:30 🇬🇧 Mortgage Approvals (Sep)
12:30 🇺🇲 Goods Trade Balance (Sep)
12:30 🇺🇲 Retail Inventories (Sep)
12:30 🇺🇲 Wholesale Inventories (Sep)
13:00 🇺🇲 S&P C-S Home Prices (Aug)
13:00 🇺🇲 FHFA House Price Indx (Aug)
14:00 🇺🇲 JOLTS (Sep) ⚠️
14:00 🇺🇲 CB Consmer Confdnce (Oct)
17:00 🇺🇲 7-Year Note Auction
Wednesday
00:30 🇦🇺 Monthly CPI (Sep)
06:30 🇫🇷 GDP preliminary (Q3)
08:55 🇩🇪 Unemployment Rate (Oct)
09:00 🇩🇪 GDP Flash (Q3)
09:00 🇪🇺 GDP Flash (Q3) ⚠️
10:00 🇪🇺 Economic Sentiment (Oct)
11:00 🇺🇲 MBA Mortgage Apps
12:15 🇺🇲 ADP Employment Chnge (Oct)
12:30 🇬🇧 UK Autumn Budget
12:30 🇺🇲 US GDP (Q3) ⚠️
12:30 🇺🇲 Treasury Refunding
13:00 🇩🇪 German CPI (Oct)
14:00 🇺🇲 Pending Home Sales (Sep)
Thursday
01:30 🇨🇳 NBS PMIs (Oct)
03:00 🇯🇵 BOJ RATES DECISION ⚠️
07:00 🇩🇪 Germany Retail Sales (Sep)
10:00 🇪🇺 Eurozone CPI (Oct)⚠️
11:30 🇺🇲 Challenger Job Cuts (Oct)
12:30 🇺🇲 PCE Price Index (Sep) ⚠️
12:30 🇺🇲 Personal Spending (Sep)
12:30 🇺🇲 Personal Income (Sep)
12:30 🇺🇲 Employment Cost Index (Q3)
12:30 🇺🇲 Jobless Claims
13:45 🇺🇲 Chicago PMI (Oct)
Friday
01:45 🇨🇳 Caixin Manufctring PMI (Oct)
07:00 🇬🇧 Natnwide House Prices (Oct)
12:30 🇺🇲 Nonfarm Payrolls (Oct) ⚠️
12:30 🇺🇲 Unemployment Rate (Oct)⚠️
12:30 🇺🇲 Average Hourly Earnings (Oct)
13:45 🇺🇲 S&P Mfg PMI Final (Oct)
14:00 🇺🇲 ISM Manufctring PMI (Oct) ⚠️
Times above in GMT ⌚
Macro Dose retweeted
THE WEEK AHEAD ⚠️
Monday
02:15 🇨🇳 1+5Y Loan Prime Rate
07:00 🇩🇪 German PPI (Sep)
13:55 🇺🇲 Fed Logan Speech
15:00 🇺🇲 CB Leading index (Sep)
18:00 🇺🇲 Fed Kashkari Speech
22:05 🇺🇲 Fed Schmid Speech
11:40 🇺🇲 Fed Daly Speech
Tuesday
15:00 🇪🇺 ECB Lagarde Speech
15:00 🇺🇲 Fed Harker Speech
14:00 🇺🇲 Richmond Fed Mfg Idx (Oct)
20:15 🇪🇺 ECB Lagarde Speech
Wednesday
12:00 🇺🇲 MBA Mortgage Apps
14:00 🇺🇲 Fed Bowman Speech
14:45 🇨🇦 BOC Rates Decision⚠️
15:00 🇪🇺 ECB Lagarde Speech
15:00 🇪🇺 Consumer Confidence (Oct)
15:00 🇺🇲 Existing Home Sales (Sep)⚠️
17:00 🇺🇲 Fed Barkin Speech
18:00 🇺🇲 20-Year Bond Auction
19:00 🇺🇲 Fed Beige Book ⚠️
Thursday
01:30 🇯🇵 Jibun Bank PMIs (Oct)
08:15 🇫🇷 France HCOB PMIs (Oct)
08:30 🇩🇪 German HCOB PMIs (Oct)
09:00 🇪🇺 Eurozone HCOB PMIs (Oct)
09:30 🇬🇧 UK S&P PMIs (Oct)
11:00 🇬🇧 CBI Busness Optimsm (Q4)
11:00 🇬🇧 CBI Industrial Trends (Oct)
13:30 🇺🇲 Chicago Fed NAI (Sep)
13:30 🇺🇲 Jobless Claims
14:45 🇺🇲 Fed Hammack Speech
14:45 🇺🇲 S&P PMIs (Oct) ⚠️
15:00 🇺🇲 New Home Sales (Sep)⚠️
21:30 🇺🇲 Fed Balance Sheet
Friday
00:01 🇬🇧 Gfk Consmer Confdnce (Oct)
09:00 🇪🇺 Consumer Infltion Exp (Sep)
09:00 🇩🇪 IFO Business Climate (Oct)
13:30 🇺🇲 Durable Goods (Sep)⚠️
15:00 🇺🇲 UMich Consmer Sent F (Oct)
All times in GMT + 1 ⌚
Macro Dose retweeted

⚠️ UK retail sales were stronger than expected. But we need a VAR check. Most of the upside was driven by an unusual surge in computer/telecomm sales (back to school effect?). But spending on big-ticket or luxury items remains at '09/'10 lows. Far from a booming UK consumer $GBP

Macro Dose retweeted
⚠️ It's not just that UK CPI missed big. This was one of the weakest Sep MoM prints for core over last 25yrs. Opens door to a 50bps BoE cut in Nov (ie, "we should've cut in Sep"). And where markets realise UK CPI not stickier vs. other G10 with terminal rates repricing lower $GBP

Macro Dose retweeted
The UK still has a labour market data problem
It is pretty difficult to dig through the UK's employment data at present due to the minefield of statistics that the Office for National Statistics continues to urge caution around.
The Office for National Statistics reported that they believe the Workforce Jobs, Claimant Count Data as well as PAYE real time data appear to currently be more reliable sources of data pertaining to the UK labour market at present.
They reinforced that the Labor Force Survey continues to be suffering as the result of poor sample sizes and thus increase volatility. It has been demoted from an official statistic to a 'statistic in development' by the ONS.
Data released today was as follows:
Unemployment Rate (3M to Aug)
4.0% (Exp. 4.1%, Prev. 4.1%)
Source: Labour Force Survey
Status: Statistic in Development
PAYE HMRC Payrolls change (Sep)
-15K (Exp. 20.2K. Prev. -35K)
Source: HMRC Real Time
Status: Statistic in Development
Employment change
373K (Exp. 250K, Prev. 265K)
Source: Labour Force Survey
Job vacancies
Vacancies fell by 34,000 to 841,000 in July to September 2024. Although job vacancies have fallen substantially, they remain above pre-COVID levels but have now fallen consecutively for the longest period on record – 27 months.
Claimant count change (Sep)
The number of people seeking unemployment benefits increased on the month with claimant count change increasing by 27.9K (Exp. 20.2K, Prev. 0.3K).
UK Avg. Earnings inc. bonus
3.8% (Exp. 3.8%, Prev. 4.1%)
Source: Monthly Wages and Salaries Survey (MWSS)
UK Avg. Earnings ex. bonus
4.9% (Prev. 5.1%, Exp. 4.9%)
Source: Monthly Wages and Salaries Survey (MWSS)
Key Takeaways:
1. The ONS continues to emphasize that figures from the Labour Force Survey (LFS), which produces the unemployment rate amongst other data, should not be individually relied upon.
2. Since 2020 there had not been any negative months of HMRC PAYE data on payrolls until this year. There has now been 4 months of negative payrolls in 2024 so far.
3. Unemployment rate (from the LFS) has continued to fall to a historically low level since May after rising throughout most of the first half of the year. From the same data source, employment change came in very strong at 373K, well above expectations. However, as discussed above, this data should be taken with a sprinkle of salt, especially given other indicators producing cooler data.
4. Job vacancies continues to decline for the 27th consecutive period, but do remain above pre-pandemic levels. This data comes from the ONS Vacancy Survey of 6100 businesses across the UK and is classified as an official statistic.
5. Wage growth excluding bonuses advanced at the slowest rate in 2 years, providing the BOE with further evidence for easing inflationary pressures. However, the wage data including bonuses is markedly affected by base effects from last summer's one off payments given to healthcare and civil service staff.
Overall:
Although the unemployment rate continued to fall and employment from the LFS continued to increase there are signals that the UK labour market continues to cool in data that the Office for National Statistics states is likely currently a better representation of reality.
Realtime HMRC payrolls and vacancies fell. Meanwhile the number of people seeking unemployment benefits rose, and has done so for 11 of the last 12 months. HMRC payrolls had not declined month over month since 2020 until this year, in which 4 months have reported negative headlines.
Wage growth continues to cool but the year over year data this month is skewed to look cooler due to base effects of a once off payment for civil service and healthcare staff seen last summer. Nonetheless, the Bank of England will be encouraged by the continued decline in wage growth as they look to plan their cycle of rate cuts as inflationary pressures ease.


Macro Dose retweeted
THE WEEK AHEAD ⚠️
Well, here's my best attempt at writing a week ahead for this week. 😂
Federal Reserve radio is on loud and proud with who knows how many speakers (literally who knows)
Everywhere I look says something different.
MONDAY
07:00 🇩🇪 German Factory Orders (Aug)
07:00 🇬🇧 Halifax House Prices (Sep)
10:00 🇪🇺 Retail Sales (Aug)
18:00 🇺🇲 Fed Bowman Speech
18:50 🇺🇲 Fed Kashkari Speech
20:00 🇺🇲 Consmer Credit Chnge (Aug)
23:00 🇺🇲 Fed Bostic Speech
23:30 🇺🇲 Fed Musalem Speech
TUESDAY
00:01 🇬🇧 BRC Retail Sales (Sep)
01:30 🇦🇺 NAB Businss Confdnce (Sep)
07:00 🇩🇪 Industrial Production (Aug)
08:00 🇺🇲 Fed Kugler Speech
11:00 🇺🇲 NFIB Busness Optimsm (Sep)
13:30 🇺🇲 Balance of Trade (Aug)
17:45 🇺🇲 Fed Bostic Speech
18:00 🇺🇲 3 Year Note Auction
21:00 🇺🇲 Fed Collins Speech
WEDNESDAY
00:30 🇺🇲 Fed Jefferson Speech
07:00 🇩🇪 Balance of Trade (Aug)
12:00 🇺🇲 MBA Mortgage Apps
13:00 🇺🇲 Fed Bostic Speech
14:15 🇺🇲 Fed Logan Speech
15:00 🇺🇲 Wholesale Inventories (Aug)
15:30 🇺🇲 Fed Barkin Speech
15:30 🇺🇲 Fed Goolsbee Speech
17:30 🇺🇲 Fed Jefferson Speech
18:00 🇺🇲 10 Year Note Auction
19:00 🇺🇲 FOMC MINUTES ⚠️
22:00 🇺🇲 Fed Collins Speech
23:00 🇺🇲 Fed Daly Speech
THURSDAY
00:01 🇬🇧 RICS House Price Bal (Sep)
07:00 🇩🇪 German Retail Sales (Aug)
13:30 🇺🇲 US CPI (Sep) ⚠️
13:30 🇺🇲 Jobless Claims
14:15 🇺🇲 Fed Cook Speech
15:30 🇺🇲 Fed Barkin Speech
16:00 🇺🇲 Fed Williams Speech
18:00 🇺🇲 30-Year Bond Auction
FRIDAY
00:00 🇯🇵 Reuters Tankan Idx (Oct)
07:00 🇬🇧 UK GDP Monthly (Aug)
07:00 🇬🇧 UK Trade Balance (Aug)
07:00 🇬🇧 Industrial Production (Aug)
07:00 🇬🇧 Manfacturing Product (Aug)
13:30 🇨🇦 Unemployment Rate (Sep)
13:30 🇺🇲 US PPI (Sep)⚠️
14:45 🇺🇲 Fed Goolsbee Speech
15:00 🇺🇲 UMich Consmer Sent (Oct)⚠️
15:45 🇺🇲 Fed Logan Speech
18:10 🇺🇲 Fed Bowman Speech
Times above in GMT +1 (BST)⌚
Macro Dose retweeted
Multiple Job Holders from the Household Survey continues to grow
Now at an all time high

Macro Dose retweeted
Labor market week⚠️
TLDR scorecard thus far
1. JOLTS: Job openings increased, above forecast (still in downtrend), further slowing in hiring (well below median since 2000) and less people leaving their jobs voluntarily, likely because it has become harder to find employment.
2. ADP Employment Change: Most private jobs added in 3 months, well above forecast. Breaks a 5 month trend of slowing in jobs added MoM. Medium and large sized companies increased workforce while small companies shed numbers. Biggest increase seen in construction.
Pending
Challenger Job Cuts - Thurs
Jobless Claims - Thurs
Nonfarm Payrolls et al- Fri
Macro Dose retweeted
⚠️ Good to see the ADP wage data showing job-switching pay growth easing to multi-year lows... which is exactly what you should see given the sharp fall in the quits rate (from JOLTS) $USD

Macro Dose retweeted
THE WEEK AHEAD ⚠️
Well, this week is busy. Labor market week is back with a vengeance.
MONDAY
02:30 🇨🇳 NBS PMIs (Sep)
02:45 🇨🇳 Caixin PMIs (Sep)
07:00 🇬🇧 GDP Growth Rate F (Q2)
09:30 🇬🇧 BOE Consumer Credit (Aug)
09:30 🇬🇧 Mortgage Approvals (Aug)
13:00 🇩🇪 German Inflation Rate (Sep)
13:50 🇺🇲 Fed Bowman Speech
14:45 🇺🇲 Chicago PMI (Sep)
15:30 🇺🇲 Dallas Fed Mfg Index (Sep)
18:55 🇺🇲 Fed Powell Speech ⚠️
TUESDAY
10:00 🇪🇺 Eurozone Inflation Rate (Sep)
15:00 🇺🇲 ISM Manfctring PMI (Sep) ⚠️
15:00 🇺🇲 JOLTS (Aug) ⚠️
14:45 🇺🇲 S&P Mfg PMI Final (Sep)
16:00 🇺🇲 Fed Bostic Speech
16:00 🇺🇲 Fed Cook Speech
23:15 🇺🇲 Fed Barkin Speech
23:15 🇺🇲 Fed Bostic Speech
23:15 🇺🇲 Fed Collins Speech
WEDNESDAY
00:50 🇯🇵 Tankan Large Mfg Index (Q3)
06:00 🇯🇵 Consumer Confidence (Sep)
07:00 🇬🇧 Natnwide House Prices (Sep)
10:00 🇪🇺 Unemployment Rate (Aug)
13:15 🇺🇲 ADP Employment Chnge (Sep)
14:00 🇺🇲 Fed Hammack Speech
15:05 🇺🇲 Fed Musalem Speech
16:00 🇺🇲 Fed Bowman Speech
17:15 🇺🇲 Fed Barkin Speech
THURSDAY
10:00 🇪🇺 Eurozone PPI (Aug)
12:30 🇺🇲 Challenger Job Cuts (Sep)
13:30 🇺🇲 Jobless Claims
14:45 🇺🇲 S&P Services PMI Final (Sep)
15:00 🇺🇲 ISM Services PMI (Sep)⚠️
15:00 🇺🇲 Factory Orders (Aug)
15:40 🇺🇲 Fed Bostic Speech
FRIDAY
08:30 🇪🇺 HCOB Constrction PMI (Sep)
09:30 🇬🇧 S&P Construction PMI (Sep)
13:30 🇺🇲 Nonfarm Payrolls (Sep)⚠️
13:30 🇺🇲 Unemployment Rate (Sep)⚠️
13:30 🇺🇲 Average Hrly Earnings (Sep)
14:00 🇺🇲 Fed Williams Speech
15:00 🇨🇦 Ivey PMI (Sep)
Times are in GMT +1 (BST)⌚
Macro Dose retweeted
The CB Consumer Confidence Survey made a bit of a splash today, coming in weaker than anticipated.
Here’s what it is and what it means
Published on the last Tuesday of each month by the Conference Board, consumer confidence measures the feelings that consumers have toward the economy at present and 6 months in advance. The data is collated from survey responses of US households. The typical number of responses that the survey utilises is 3,500 from a sample of 5,000 households. A reading of 100 on the survey is equal to the average reading of the benchmark year (1985) chosen by the Conference Board. This particular preliminary set of data had a cut off of Sept 17th, before the Fed decision to cut rates.
Why does consumer confidence matter?
It is seen as an early indicator of the performance of the economy. Consumer spending accounts for around 70% of US GDP. So, if consumers are worried and considering tightening their purse strings then these expectations might directly impact the economy as this is then manifested in more conservative spending patterns.
Consumer confidence indexes are also useful because of their timeliness of release; they give an early indication of the direction of movement well before harder data is reported and able to confirm/deny.
What did the data say?
Consumer confidence 98.7 (Prev. 105.6, Exp 103.8)
Present 124.3 (Prev. 134.6)
Expectations 81.7 (Prev. 86.3)
- Expectations below 80 generally signals recession ahead according to the CB.
1. The decline in consumer confidence was the biggest seen in around 3 years. The deterioration was broad based. Consumers became more downbeat on expectations for future income, business and labor market conditions while their perception of current conditions also softened with regards to business and the labor market.
2. Interestingly, consumers under the age of 35 were the most confident of the current economic outlook. However, confidence of those earning less than $50,000 per year has been the most negatively impacted.
3. Inflation remains a top priority for consumers.
4. Plans for purchasing homes and cars actually. improved marginally.
5. Around 20% of consumers felt business conditions are currently bad, an increase from 17.3% in the prior month. 18.8% felt conditions were good, down from 21.1%.
6. The number of consumers reporting jobs becoming more difficult to get increased to 18.3% (Prev. 16.8%); this is the highest since 2021. However, more consumers still believe jobs are plentiful at 30.9% (Prev. 32.7%), despite this metric being in a downward trend as the labor market softens.
7. Families’ perceptions of their current financial situation has also been in a gradual general downtrend over the course of 2024. However, it should be noted that more families still identify their current situation as good – but its getting notably closer.
8. The fraction of consumers that see a recession in the next year remains low.