Python library for creating static, animated, & interactive visualizations. Chat w/ us @ https://xitter.cf/t.co/QDNR5Khj9w Sponsored by @NumFocus

Joined March 2017
Working on any fun fall projects? Join our next data craft circle gathering for cozy crafting and conversations! Whether you bead, collage, embroider, or just want to try something new, come meet others who are working on analog data projects. buff.ly/f9RFGPV
1
5
1,316
Matplotlib retweeted
Maybe the final one... maybe... Made with #python #numpy #matplotlib #numba #builtWithMarimo
5
28
241
4,158
Matplotlib retweeted
A classical symmetric Field–Golubitsky attractor. #builtWithMarimo Made with #python #numpy #numba #matplotlib
7
57
3
305
15,520
Matplotlib retweeted
SW Puerto Rico seismic sequence [Almost 7 yrs update]: still active. Data: @USGS_Quakes @redsismica @uprm Processing/plots: #python @matplotlib #numpy #pandas #geopandas
1
1
2
526
Matplotlib retweeted
Two maps from ℂ to ℂ, a few numbers, and a lot of iterations. #builtWithMarimo #python #numpy #matplotlib
6
14
1
180
4,781
Matplotlib retweeted
2
13
108
4,019
Matplotlib retweeted
Today is the last day to submit your CFP for PyData Global 2026! Don't wait, get yours in now! Learn more and submit your proposal now at hubs.la/Q04v3LQK0
1
1
3
2,274
When I teach #DeepLearning and #MachineLearning, I like to build the models with my students piece by piece. For example, we construct a simple artificial #NeuralNetwork from scratch and then train it using only fundamental mathematics: - linear algebra - derivatives - the chain rule Once the mathematics clicks, we bring it to life with an interactive @Matplotlib dashboard so students can see how the network learns. I've shared the notebook on #GitHub: github.com/GeostatsGuy/DataS…
3
48
411
13,094
The PSF Diversity & Inclusion Workgroup's first monthly office hour is next Tuesday, July 28 at 1 PM UTC on the PSF Discord! We hope you join us in the psf-diversity channel to chat, ask questions, and share what you're working on 🐍 🗺️ pyfound.blogspot.com/2026/07… pyfound.blogspot.com/2026/07…
1
7
1
27
17,990
Matplotlib retweeted
Eigenfish Made with #python #numpy #matplotlib #marimo
1
15
1
105
3,006
We want your vote! Voting eligible PSF Members (Supporting, Contributing, and Fellow) need to affirm their membership to vote in this year’s PSF Board and/or Python Packaging Council elections to ensure that each election reaches quorum 🗳️ #python pyfound.blogspot.com/2026/07… pyfound.blogspot.com/2026/07…
22
17
9,888
Matplotlib retweeted
Want to contribute to #matplotlib but don't know where to start? Join us for a live session on how to help us triage issues and PRs on GitHub! 📅 July 14th · 2pm UTC 🔗 hackmd.io/@matplotlib/triage… Bring your questions - all are welcome!
5
10
2,442
Matplotlib retweeted
Eigenvalues of random matrices Made with #python #numpy #matplotlib and #marimo
9
74
3
562
30,772
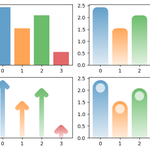
Fun plotting challenge: Recreate this with @matplotlib
powerful moments in bar chart technology
2
1
31
9,310
Bayesian updating is one of the most powerful ideas in data science 🔄📊 ... and most people still underuse it! You start with a belief (prior)… then reality shows up (data)… and you update your mind (posterior)! 🚀 That’s it. That’s the magic. But here’s where it gets interesting 👇 Weak prior vs strong prior Little data vs lots of data Wrong assumptions vs robust inference Watch uncertainty move in real time! I built an interactive #Python @matplotlib dashboard so you can experience it: 👉 github.com/GeostatsGuy/DataS… Play with it, break it, rebuild it 🧠⚡Stoked!
7
88
3,865
2026-06-01 M6.2 22 km WSW of Scarcelli, Italy #earthquake 3D area historical seismicity. 243 km deep event in the southern Tyrrhenian subduction zone, here shown in a 10° x 10° x 700 km volume. Reference land contours are plotted in green. @matplotlib #CitizenScience
1
5
19
2,163
Matplotlib retweeted
Another one! Made with #python #numpy #matplotlib and #marimo (and also #wigglystuff)
41
628
34
5,454
277,909
Tree-based gradient boosting is an ensemble method that builds a powerful prediction model by sequentially adding weak learners (often decision tree stumps). 🌲📈 To help my students really get it, I built a #Python @matplotlib interactive dashboard 🚀🐍 Step through each stump and watch the model update as the residuals and error evolve in real time! 🔥🎯 #MachineLearning #DataScience #AI #Python
2
7
59
3,150
Matplotlib retweeted
📣 If you’re at #PyConUS2026 next week, catch @InessaPawson and @juanitagomezr at the Community Showcase on Sunday with flyers and stickers for #SciPy2026! 🙌 If you have questions about the conference or just want to connect with the community, this is your chance 🎉
3
11
1,931
I’m stoked to teach density-based cluster analysis to my students! 🔥 Agglomerative clustering is a bottom-up hierarchical method: each point starts as its own cluster, then pairs of clusters are repeatedly merged based on similarity until one tree of clusters (a dendrogram) is formed 🌳 Very intuitive—it mirrors how we naturally perceive structure—like pointillism 🎨, where meaning emerges by progressively merging nearby points of similarity into coherent patterns! To help my students visualize density-based cluster analysis, I built an interactive #Python dashboard with @matplotlib 📊🚀
3
33
2,611