

Trading is a game of chess Veteran Financial Trader | MSc Finance Creator of 'The Perfect Storm Index'™ Crypto • Elliott Wave 40+ years navigating market cycles
Brighton UK
Joined March 2013
- Tweets17.4K
- Following11K
- Followers22.7K
- Likes38K



Pinned Tweet
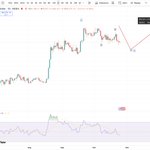
#SOL’s decline has been sharp, but my preferred interpretation is an ABC correction, with an extended wave C reaching approximately 2.618 times wave A near $101.
Bullish RSI divergence and the subsequent rebound support a potential low, although confirmation is still needed.
I’m watching for five waves higher, then a corrective pullback that holds above the low. That would strengthen the case for further upside.
Any staged accumulation on my part would stay within a predefined risk limit. Step by step.

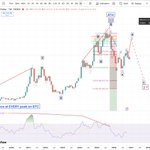
So far, #BTC is tracking the projected pullback. Two valid short-term counts remain in play, and both favour completion of this correction before another move higher.
Confirmation that the correction has ended is still needed. Step by step.


Expectations often overshoot in both directions near market highs and lows. As traders, we need to guard against extrapolating the latest trend indefinitely.
Elliott Wave provides a framework for interpreting crowd behaviour, while Fibonacci levels help identify potential targets, not guaranteed turning points.
Divergences, as shown on this chart shows that Traders recognise this "overshooting" phenomenon and actually momentum fades at each ATH & ATL
Keep updating the count as the evidence changes.

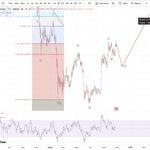
Another alternative for #FET
If this is a completed barrier triangle, it implies the corrective recovery has already ended at E, with another downward leg underway. A break below D, approximately $0.12, would support that interpretation. A move above E, approximately $0.27, would invalidate the proposed completed-E count.

If you want the latest #Crypto news then CryptoAttention.com is the place to go.
It scans important crypto news gathering and assessing the sentiment from over 1,000 sites daily.
The most powerful news/sentiment tool imo

I’ve been asked about #ADA.
The shaded rebound looks corrective within the broader downtrend. Bearish RSI divergence also warned of weakening momentum ahead of the latest decline.
That keeps a retest of the low near $0.14 and potentially a break below it in play. A recovery above the rebound high near $0.28 would challenge this interpretation.
#Cardano

Im watching this potential Alternative for #BTC

My projected #BTC low may arrive later than Q4, although a Q4 low remains possible.
The decline from the ATH appears countable as five waves: potentially wave A, wave 1, or C completing an expanded flat.
I currently favour A. Under that scenario, we’re working through a B-wave recovery, with a smaller pullback followed by another leg higher before a larger C-wave decline.
After that correction, I would look for a renewed advance towards new ATHs. A working scenario, subject to the evidence.


#OIL is pushing higher again, approaching its previous high.
A sustained rise could add to inflation pressure, keeping rates higher for longer, or increasing the risk of further hikes.
That could tighten financial conditions and create headwinds for #BTC and other risk assets. Another macro risk worth watching.

Feedback welcome on this potential #BTC scenario.
The decline from the ATH appears countable as five waves, potentially wave 1 or A.
If the initial rebound also completed five waves, it could be wave a of a larger corrective advance: a b-wave pullback, then another leg higher in c to complete 2 or B.
A completed C-wave decline remains an alternative. The next swings should help distinguish them.

Proud to share Evai’s next chapter: Crypto Attention 🚀
We’ve evolved to tackle a real need in crypto: cutting through the noise to understand which stories are gaining attention and how sentiment is shifting.
Explore 👉 cryptoattention.com

There are many uninformed, uneducated and unexperienced wannabe traders out there, coming out with abusive messages when I post valid alternate #BTC & #Crypto counts to CONSIDER.
If you dont know the alternatives OR choose to ignore them, then at some point you will be in for a NASTY surprise.
You cannot always be right BUT you can ALWAYS manage risk

Another plausible #BTC count worth considering.
The decline from the ATH can potentially be counted as five waves, which could represent:
• C completing an expanded flat
• Wave 1 of a larger decline
• Wave A of a larger ABC correction
The rebound’s structure and the next decline will help distinguish these scenarios. Keep an open mind and manage risk accordingly.

#Bitcoin has made successive cycle highs with progressively lower monthly RSI peaks.
A striking long term bearish divergence, but also a reminder that divergence can persist through substantial further gains.
A warning about momentum, not a standalone timing signal.
What are your thoughts on the #BTC Divergence cycle?

An uncomfortable #BTC alternative, but one worth considering when assessing risk.
If this rebound is a B wave, a substantial C wave decline could follow. The dashed path illustrates that scenario, not a certain outcome or precise target.
Keep valid alternatives in view. Trade the evidence, manage the risk.

Markets are pricing an almost 90% chance of higher Fed rates by December in this CME FedWatch snapshot, including a 13% chance of a cumulative 50bp increase.
That could tighten financial conditions and create headwinds for #BTC and #Crypto, particularly if expectations turn more hawkish.
Short term upside remains possible, but another correction is a risk I’m watching.
