

The fastest path to full stack observability. Per-second metrics, zero-config setup, and Netdata AI guiding fixes. For status updates, follow @netdatastatus
Joined May 2016
- Tweets2.8K
- Following171
- Followers4K
- Likes3.1K








Pinned Tweet
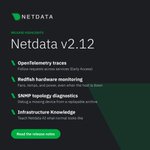
Netdata v2.12 landed two weeks ago: OpenTelemetry traces (Early Access) join metrics and logs, Redfish keeps hardware monitoring running when the host is down, and you can now tell Netdata AI what normal looks like in your setup. Details: github.com/netdata/netdata/r…

Expose your OpenTelemetry traces with Netdata: filter by duration, narrow it to one service, and visualize even the most complex applications on one timeline. Every span stays on your own nodes. Now in early access in Netdata Cloud. Read how it works: tinyurl.com/4xhz9fb9
Your servers look healthy. Your users are stuck on a slow checkout page.
On Oct 29, we're introducing Digital Experience Monitoring in Netdata, live: Real User Monitoring plus Browser Synthetic Checks.
Register here: tinyurl.com/yt849h7m

Production is down; a chart shows a weird spike, and nobody knows who built that panel or why. Why dashboards became a job nobody signed up for, and why Netdata generates them from the metrics instead: tinyurl.com/3rpn73j5

Our CEO, Costa Tsaousis, is speaking at OSOD 2026: "Agentic Observability: The Path to AI Co-SRE." Online conference, October 15–16. Register here: osoday.com/register

Hundreds of nodes, and one of them is acting up. How fast can you find it? Our new video shows how Netdata gives you one view of your whole fleet, so the outlier stands out. Watch: youtu.be/4YTNGtp_PMQ
Netdata AI sees a disk spike on backup-01 and might flag it. Your on-call knows it's just the nightly backup.
Infrastructure Knowledge lets you teach Netdata AI that context, so it interprets your metrics instead of guessing.tinyurl.com/2spbhb34

Catch our VP of Product & Strategy, Shyam Sreevalsan, at SRE Day London tomorrow.
Track 1, 13:00: "Agentic Observability: The Path to AI Co-SRE." How AI agents move from assisting SREs toward a real co-SRE.
At the event on 24 Sept? Don't miss it.

That spike on your CPU chart won't mean much in six weeks. You won't remember it was Tuesday's migration.
Chart annotations pin the context (deploy, incident, config change) right onto the chart in Netdata, visible to your whole Space. tinyurl.com/2ue4z7jn

Your alert says latency spiked at 14:03. It won't mention the deploy that shipped at 13:59.
Netdata AI now reads context from GitHub, PagerDuty, and Atlassian over MCP while it investigates. tinyurl.com/44k9d289

Metrics show a service slowed down. Traces show the request behind it.
Live webinar, first look at distributed tracing in Netdata: OpenTelemetry ingestion, a new tracing dashboard, and a jump from anomaly to the exact span.
Wed, Sep 30, 3 PM UTC. Register: tinyurl.com/mdvd8wu5

A container can say "Up" while the app inside it is dead. Three ways Docker fails silently: disks that fill without warning, restart loops that hide OOM kills, dockerd freezing while still "running." Guide: tinyurl.com/y4vrzhrmand

TMB runs Barcelona's metro and buses across AWS and bare metal, Linux, Windows, Kubernetes, cloud, and on-prem, with one DevOps team and 1.6M people served.
Netdata gave them per-second visibility across the whole stack. Case study: tinyurl.com/mv3knzvw
Missed yesterday's webinar on fleet monitoring with Netdata? It's recorded.
Real-time, per-second metrics across your whole fleet, from a handful of nodes to thousands. Watch it here: youtube.com/watch?v=Vcph_ctY…

Fleet Monitoring with Netdata Wed, Aug 26 · 2 PM UTC
See how to monitor thousands of distributed nodes with per-second visibility, on-device ML anomaly detection, and no per-metric pricing.
Register: tinyurl.com/32fb8bfj

Netdata v2.11 is here.
One place for your servers, your network, and your logs: a new Network Monitor dashboard, flow analysis, automatic topology maps, an SNMP trap listener, and OpenTelemetry logs.
Release notes: github.com/netdata/netdata/r…
80,000 GitHub stars. ⭐
Per-second metrics, zero configuration, single node to full fleet, ML-assisted anomaly detection, and an MCP server for AI-assisted troubleshooting.
Thank you to the engineers, operators, and teams who rely on Netdata every day. github.com/netdata/netdata
Who's really talking to whom on your network? Netdata's NetFlow view shows your top traffic sources live, by protocol, port, country, or on a live 3D globe.
See it in action: youtu.be/SmOc7ebMNDo

Walkthrough of our network topology setup: how we monitor and map infrastructure at scale. Worth a watch if you're into observability.
🎥 youtu.be/oTOvoas9DiQ
