




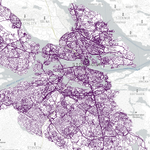

When visiting a new city I always plan around neighborhoods rather than specific sights. This website will come in handy! from-to.app/ It draws parallels between neighborhoods in a city you know and the one you don’t. **Consider supporting the creator!**
Nina Lindell retweeted

What is #dataviz animation good for? A thread with examples.
This Thursday, May 6th, RJ Andrews @infowetrust himself will join Stockholm #dataviz meetup to talk about his upcoming book. Don’t miss it! meetup.com/Data-Visualizatio…
🥁🥁If you ever wanted to create more non-standard and beautiful visualizations don’t miss the next Stockholm #Dataviz meetup where @maartenzam himself will share how he does cool things in @rawgraphs. April 13, 17.30 CET. Sign up here: meetup.com/Data-Visualizatio…
Stockholm #Dataviz meetup is growing and on Feb 23rd @duncangeere and @miriamquick themselves (!) will join us to share how they tell stories with music and data. A great opportunity to ask all your questions! Sign up here meetup.com/Data-Visualizatio…
Nina Lindell retweeted

I'm excited to speak at #dataviz Stockholm meetup tomorrow ⚡️
We'll discuss the data design process using my DVS census graphic below as an example. If you want to know how the vis came to life *and* see the bloopers, join us! 📊


🌟🌟
Excited for the next Stockholm #dataviz meetup with the talented @evelinajud. ☺️ Join us!
#12 Practicing the Craft of Dataviz Design ** Public Sector Data Platforms meetup.com/Data-Visualizatio…
🌟🌟
Excited for the next Stockholm #dataviz meetup with the talented @evelinajud. ☺️ Join us!
#12 Practicing the Craft of Dataviz Design ** Public Sector Data Platforms meetup.com/Data-Visualizatio…
Interesting initiative by Tableau. Thank you @SParsonsDataViz for sharing!

#Datafam friends! We're working with 3 charities and are donating to help young people with their digital/data skills. For every person that takes our data literacy course, we'll donate. It's that simple! #tableau tableau.com/en-gb/learn/data…

“How do you create #dataviz that works for 290 different versions of an article?” Join the online edition of Dataviz Stockholm meetup this Wednesday, Dec 9th to hear how @jensfinnas and @cguibourg from newsworthy.se solve the challenge. meetup.com/Data-Visualizatio…
Nina Lindell retweeted

W48 | The impact of Operation Fistula's Pilot Programs. 🙌🏻
The visualization based on #DataHumanism ✨ tells the story of the outsized & concrete impact that this kind of funding has on a woman's life. @OpFistula
#MakeoverModay #MMVizReview
Link: bit.ly/W48LizBravo

Love all Katie’s #spatial work!

I put together a collage last night of all the maps I’ve made this month so far! 🗺 All of my R scripts for the basic maps are available here (most of the labeling is done in Illustrator to be ⚡️faster): github.com/katiejolly/30-day…


This is amazing. Looks like there so many analysis angles in this book.
This Post is from an account that no longer exists. Learn more
Nina Lindell retweeted

#TidyTuesday Week 34. I saw this very cool viz by @Evelina_Jud and automatically inspired me to make my own on ggplot taking advantage of this week's data, and here is the result.
Code: bit.ly/3iUlrPT 🌸
#rstats #tidyverse #ggplot #r4ds #dataviz


🚀 New project preview
👉I present to you a #datavis that will be featured in an upcoming book project I'm contributing to.
📝A fun analysis based on the list of the best datavis books by @infobeautiful @DataVizSociety
🚨 If there's something you think I should change, DM me!

Nina Lindell retweeted

I made a little article about the creation of the data-art "Family tree. The Mezen folk painting"
eolay.tilda.ws/mezen_tree/en
Take a look! ☺️
#dataviz #dataart #familytree #ethnic

Nina Lindell retweeted

#The100DayProject
I’m imagining what a #dataviz designer’s wallpaper would look like throughout the past century. 🤗
Here’s my #DataVizWallpaper for 1920!

#OpenDataDay 2020 is around the corner! Swedish edition is happening at @stiftelsen on March 7th. Join us if you are in town! #oppnadata @CivicTechSE
meetu.ps/e/HMsmX/hGhn2/a
Nina Lindell retweeted

The recording of my #rstudioconf talk, The Glamour of Graphics is up! 💅 Enjoy, and keep in mind these are guidelines, not rules. #rstats resources.rstudio.com/rstudi…
Nina Lindell retweeted

I have started collecting slide material for all the wonderful talks at #rstudioconf ✨
PR are welcome!
github.com/EmilHvitfeldt/RSt…
#rstudioconf2020 #rstats


Nina Lindell retweeted

Inspired by @AdiBop_ insane maps, I've mapped out vehicle casualties across the UK, it took me longer than I'd like to admit to create the map in @Mapbox🙈it's motivated my spatial journey💃#30DayMapChallenge
explore here ->tabsoft.co/2CK3wbC
@tableaupublic @tableau
