

Server and web monitoring service.
Amsterdam
Joined April 2015
- Tweets229
- Following14
- Followers291
- Likes77




Nixstats retweeted

Do you want to know how we keep our IP addresses clean with @nixstats? We tell you all about it in today's blog!
bit.ly/XldreG5H

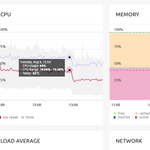
We've added a dark layout option as well as a tv-mode which hides the top headers. Perfect for displaying your dashboards on a tv.
We've added the CPU temperature to the servers overview page. help.nixstats.com/en/article…

There is an issue with our DNS provider @Cloudflare in some regions. This could affect our API as well as the Dashboard for some users.

We just launched a new blacklist check feature. Monitor your IP and hostname reputation. Free during the Beta!

The nginx dashboard now shows data recieved through logging (latest errors, response codes and top pages).


We've added several new features to our Logging beta including: search, timeline, history, jump to time and logging alerts!


We're launching a closed beta for Logging at Nixstats. Contact us to get setup! You can search and tail log files across all your servers!
We've added a premade dashboard for PHP-FPM. If you're not yet monitoring PHP-FPM take a look at the integration guide help.nixstats.com/en/article…

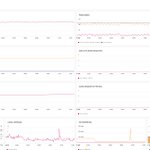
We've added another premade dashboard for MySQL. If you're not yet monitoring MySQL take a look at the integration guide help.nixstats.com/en/article…

The granularity of charts is now based on your screen size, a larger screen will now show a more fine granularity.

