

North Sentinel Mapper and NS Stat Mapper ● Maps 🗺, Statistics 📊 and History ⏳️ ● Cumulative and Aggregate Data on Demographics, Society and Economics.
North Sentinel Island
Joined June 2025
- Tweets10.1K
- Following134
- Followers4.3K
- Likes1.2K




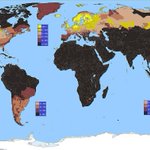
Immigrant population in Croatia 🇭🇷, 1990-2024
Source = Migration Policy Institute and Macrotrends
1990 -> 475,438
1995 -> 674,085
2000 -> 585,298
2005 -> 579,273
2010 -> 573,248
2015 -> 561,093
2020 -> 528,056
2024 -> 527,831

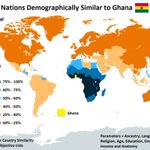
Nations Demographically similar to Ghana 🇬🇭
Source = Country Similarity Index, Objective Lists
01. Kenya 🇰🇪 = 85%
02. Cameroon 🇨🇲 = 84%
03. Republic of Congo 🇨🇬 = 83.5%
04. Zambia 🇿🇲 = 83%
05. Liberia 🇱🇷 = 82.5%
06. Uganda 🇺🇬 = 82%
07. Ivory Coast 🇨🇮 = 81%
08. Tanzania 🇹🇿 = 81%
09. Central African Republic 🇨🇫 = 80.5%
10. Gabon 🇬🇦 = 80.5%
11. Malawi 🇲🇼 = 80.5%
12. DR Congo 🇨🇩 = 80%
13. Zimbabwe 🇿🇼 = 80%
14. Togo 🇹🇬 = 80%
15. Benin 🇧🇯 = 80%
16. Lesotho 🇱🇸 = 79.5%
17. Eswatini 🇸🇿 = 79.5%
18. Mozambique 🇲🇿 = 79.5%
19. Rwanda 🇷🇼 = 79%
20. Nigeria 🇳🇬 = 78.5%
21. Sierra Leone 🇸🇱 = 77%
22. Burundi 🇧🇮 = 76.5%
23. Botswana 🇧🇼 = 76.5%
24. Equatorial Guinea 🇬🇶 = 76%
25. Angola 🇦🇴 = 76%
26. Namibia 🇳🇦 = 76%
27. Gambia 🇬🇲 = 76%
28. Burkina Faso 🇧🇫 = 75.5%
29. Guinea 🇬🇳 = 75%
30. Haiti 🇭🇹 = 74%
31. Guinea Bissau 🇬🇼 = 74%
32. Senegal 🇸🇳 = 74%
33. Mali 🇲🇱 = 73%
34. South Sudan 🇸🇸 = 72.5%
35. Chad 🇹🇩 = 72%
36. South Africa 🇿🇦 = 71%
37. Jamaica 🇯🇲 = 70.5%
38. Niger 🇳🇪 = 69.5%
39. Ethiopia 🇪🇹 = 68%
40. Eritrea 🇪🇷 = 65%
41. Madagascar 🇲🇬 = 64.5%
42. Cape Verde 🇨🇻 = 63.5%
43. Mauritania 🇲🇷 = 62.5%
44. Sudan 🇸🇩 = 62.5%
45. Bahamas 🇧🇸 = 62%
46. Djibouti 🇩🇯 = 61.5%
47. Somalia 🇸🇴 = 61%
48. Guyana 🇬🇾 = 58.5%
49. Suriname 🇸🇷 = 56.5%
50. Dominican Republic 🇩🇴 = 56%
51. Honduras 🇭🇳 = 54%
52. Vanuatu 🇻🇺 = 54%
53. Belize 🇧🇿 = 53.5%
54. Morocco 🇲🇦 = 52%
55. Trinidad & Tobago 🇹🇹 = 52%
56. Nicaragua 🇳🇮 = 51%
57. Solomon Islands 🇸🇧 = 51%
58. Philippines 🇵🇭 = 51%
59. Egypt 🇪🇬 = 50.5%
60. Algeria 🇩🇿 = 50.5%
61. Guatemala 🇬🇹 = 50.5%
62. Mauritius 🇲🇺 = 49.5%
63. Afghanistan 🇦🇫 = 49%
64. Yemen 🇾🇪 = 49%
65. Brazil 🇧🇷 = 49%
66. East Timor 🇹🇱 = 48.5%
67. Papua New Guinea 🇵🇬 = 48.5%
68. Ecuador 🇪🇨 = 48%
69. Samoa 🇼🇸 = 48%
70. Libya 🇱🇾 = 47.5%
71. Bolivia 🇧🇴 = 47.5%
72. Pakistan 🇵🇰 = 47%
73. Tunisia 🇹🇳 = 47%
74. Bangladesh 🇧🇩 = 47%
75. Panama 🇵🇦 = 47%
76. Syria 🇸🇾 = 46.5%
77. Iraq 🇮🇶 = 46.5%
78. Indonesia 🇮🇩 = 46.5%
79. El Salvador 🇸🇻 = 46.5%
80. Palestine 🇵🇸 = 46%
81. Kyrgyzstan 🇰🇬 = 46%
82. Tajikistan 🇹🇯 = 45.5%
83. Colombia 🇨🇴 = 45.5%
84. Paraguay 🇵🇾 = 45.5%
85. Uzbekistan 🇺🇿 = 45%
86. Jordan 🇯🇴 = 45%
87. Venezuela 🇻🇪 = 45%
88. Turkmenistan 🇹🇲 = 44.5%
89. Albania 🇦🇱 = 44.5%
90. Fiji 🇫🇯 = 44.5%
91. Peru 🇵🇪 = 44.5%
92. Lebanon 🇱🇧 = 43.5%
93. Costa Rica 🇨🇷 = 43.5%
94. India 🇮🇳 = 43.5%
95. Laos 🇱🇦 = 42.5%
96. Turkey 🇹🇷 = 42%
97. North Macedonia 🇲🇰 = 42%
98. Cuba 🇨🇺 = 42%
99. Malaysia 🇲🇾 = 42%
100. Mexico 🇲🇽 = 42%
101. Uruguay 🇺🇾 = 41.5%
102. Azerbaijan 🇦🇿 = 41%
103. Iran 🇮🇷 = 40.5%
104. Kazakhstan 🇰🇿 = 40.5%
105. Nepal 🇳🇵 = 40.5%
106. Cambodia 🇰🇭 = 40.5%
107. Myanmar 🇲🇲 = 40.5%
108. Saudi Arabia 🇸🇦 = 40%
109. Oman 🇴🇲 = 40%
110. Chile 🇨🇱 = 40%
111. Georgia 🇬🇪 = 40%
112. Argentina 🇦🇷 = 40%
113. Montenegro 🇲🇪 = 39.5%
114. Vietnam 🇻🇳 = 39.5%
115. Bahrain 🇧🇭 = 38%
116. Kuwait 🇰🇼 = 38%
117. Bhutan 🇧🇹 = 38%
118. New Zealand 🇳🇿 = 38%
119. Sri Lanka 🇱🇰 = 38%
120. Armenia 🇦🇲 = 37.5%
121. United States 🇺🇸 = 37.5%
122. Brunei 🇧🇳 = 37.5%
123. Serbia 🇷🇸 = 37%
124. Bosnia-Herzegovina 🇧🇦 = 37%
125. Moldova 🇲🇩 = 37%
126. United Arab Emirates 🇦🇪 = 36.5%
127. Australia 🇦🇺 = 36.5%
128. Cyprus 🇨🇾 = 36.5%
129. Romania 🇷🇴 = 36.5%
130. Thailand 🇹🇭 = 36%
131. Portugal 🇵🇹 = 36%
132. Iceland 🇮🇸 = 35.5%
133. China 🇨🇳 = 35.5%
134. North Korea 🇰🇵 = 35.5%
135. Israel 🇮🇱 = 35.5%
136. Mongolia 🇲🇳 = 35.5%
137. Qatar 🇶🇦 = 35%
138. Bulgaria 🇧🇬 = 35%
139. Finland 🇫🇮 = 34.5%
140. Canada 🇨🇦 = 34.5%
141. Sweden 🇸🇪 = 34.5%
142. Belarus 🇧🇾 = 34.5%
143. Denmark 🇩🇰 = 34.5%
144. France 🇫🇷 = 34.5%
145. Hungary 🇭🇺 = 34.5%
146. United Kingdom 🇬🇧 = 34.5%
147. Slovakia 🇸🇰 = 34.5%
148. Russia 🇷🇺 = 34%
149. Czech Republic 🇨🇿 = 34%
150. Latvia 🇱🇻 = 34%
151. South Korea 🇰🇷 = 33.5%
152. Switzerland 🇨🇭 = 33.5%
153. Norway 🇳🇴 = 33.5%
154. Netherlands 🇳🇱 = 33.5%
155. Estonia 🇪🇪 = 33.5%
156. Poland 🇵🇱 = 33.5%
157. Slovenia 🇸🇮 = 33%
158. Spain 🇪🇸 = 32.5%
159. Ukraine 🇺🇦 = 32.5%
160. Croatia 🇭🇷 = 32.5%
161. Greece 🇬🇷 = 32%
162. Lithuania 🇱🇹 = 32%
163. Belgium 🇧🇪 = 31.5%
164. Italy 🇮🇹 = 31%
165. Singapore 🇸🇬 = 31%


Immigrant population in Serbia 🇷🇸, 1990-2024
Source = Migration Policy Institute and Macrotrends
1990 -> 1.06 Million
1995 -> 1.54 Million
2000 -> 1.41 Million
2005 -> 1.07 Million
2010 -> 901,044
2015 -> 797,595
2020 -> 733,091
2024 -> 712,550

Immigrant population in Bosnia-Herzegovina 🇧🇦, 1990-2024
Source = Migration Policy Institute and Macrotrends
1990 -> 56,000
1995 -> 69,476
2000 -> 82,952
2005 -> 47,287
2010 -> 38,945
2015 -> 38,597
2020 -> 36,042
2024 -> 34,120

Nations by Expenditure on Education as Share of their Nominal GDP 📚, 2025
Source = Visual Capitalist
01. Kiribati 🇰🇮 -> 16.39%
02. Tuvalu 🇹🇻 -> 12.85%
03. Micronesia 🇫🇲 -> 11.56%
04. Namibia 🇳🇦 -> 9.08%
05. Algeria 🇩🇿 -> 8.98%
06. Cuba 🇨🇺 -> 8.44%
07. Solomon Islands 🇸🇧 -> 8.29%
08. Botswana 🇧🇼 -> 8.06%
09. Marshall Islands 🇲🇭 -> 7.70%
10. Vanuatu 🇻🇺 -> 7.64%
11. Mauritania 🇲🇷 -> 7.61%
12. Bolivia 🇧🇴 -> 7.54%
13. Sweden 🇸🇪 -> 7.32%
14. Iceland 🇮🇸 -> 7.31%
15. Kyrgyzstan 🇰🇬 -> 6.83%
16. Tunisia 🇹🇳 -> 6.73%
17. Lesotho 🇱🇸 -> 6.62%
18. Moldova 🇲🇩 -> 6.56%
19. St Vincent and Grenadines 🇻🇨 -> 6.46%
20. Kuwait 🇰🇼 -> 6.44%
21. Finland 🇫🇮 -> 6.38%
22. Denmark 🇩🇰 -> 6.36%
23. Belgium 🇧🇪 -> 6.28%
24. Senegal 🇸🇳 -> 6.16%
25. Eswatini 🇸🇿 -> 6.03%
26. South Africa 🇿🇦 -> 6.02%
27. Morocco 🇲🇦 -> 6.02%
28. Mozambique 🇲🇿 -> 5.98%
29. Israel 🇮🇱 -> 5.93%
30. United Kingdom 🇬🇧 -> 5.91%
31. Bhutan 🇧🇹 -> 5.85%
32. Nauru 🇳🇷 -> 5.78%
33. Brazil 🇧🇷 -> 5.62%
34. Jamaica 🇯🇲 -> 5.51%
35. Uzbekistan 🇺🇿 -> 5.47%
36. Samoa 🇼🇸 -> 5.46%
37. Tajikistan 🇹🇯 -> 5.44%
38. Palestine 🇵🇸 -> 5.43%
39. Norway 🇳🇴 -> 5.43%
40. United States 🇺🇸 -> 5.42%
41. South Korea 🇰🇷 -> 5.41%
42. Dominica 🇩🇲 -> 5.39%
43. Burkina Faso 🇧🇫 -> 5.33%
44. France 🇫🇷 -> 5.32%
45. Costa Rica 🇨🇷 -> 5.31%
46. Tonga 🇹🇴 -> 5.31%
47. Slovenia 🇸🇮 -> 5.28%
48. Austria 🇦🇹 -> 5.28%
49. Colombia 🇨🇴 -> 5.26%
50. East Timor 🇹🇱 -> 5.24%
51. Germany 🇩🇪 -> 5.24%
52. New Zealand 🇳🇿 -> 5.21%
53. Mongolia 🇲🇳 -> 5.21%
54. Estonia 🇪🇪 -> 5.21%
55. Netherlands 🇳🇱 -> 5.18%
56. Maldives 🇲🇻 -> 5.17%
57. Ukraine 🇺🇦 -> 5.14%
58. Grenada 🇬🇩 -> 5.13%
59. Australia 🇦🇺 -> 5.06%
60. Belarus 🇧🇾 -> 5.05%
61. Sao Tome and Principe 🇸🇹 -> 5.03%
62. Argentina 🇦🇷 -> 5.00%
63. Chile 🇨🇱 -> 4.91%
64. Kazakhstan 🇰🇿 -> 4.86%
65. Switzerland 🇨🇭 -> 4.86%
66. Canada 🇨🇦 -> 4.84%
67. Uruguay 🇺🇾 -> 4.76%
68. Cyprus 🇨🇾 -> 4.74%
69. Malta 🇲🇹 -> 4.71%
70. Slovakia 🇸🇰 -> 4.66%
71. Belize 🇧🇿 -> 4.62%
72. Rwanda 🇷🇼 -> 4.61%
73. Spain 🇪🇸 -> 4.59%
74. Portugal 🇵🇹 -> 4.55%
75. Honduras 🇭🇳 -> 4.55%
76. Burundi 🇧🇮 -> 4.50%
77. Bulgaria 🇧🇬 -> 4.50%
78. Saudi Arabia 🇸🇦 -> 4.48%
79. Seychelles 🇸🇨 -> 4.45%
80. Guyana 🇬🇾 -> 4.45%
81. Brunei 🇧🇳 -> 4.43%
82. Oman 🇴🇲 -> 4.38%
83. Peru 🇵🇪 -> 4.36%
84. Cape Verde 🇨🇻 -> 4.35%
85. Afghanistan 🇦🇫 -> 4.34%
86. Latvia 🇱🇻 -> 4.32%
87. Poland 🇵🇱 -> 4.31%
88. Czech Republic 🇨🇿 -> 4.30%
89. Turkmenistan 🇹🇲 -> 4.29%
90. Lithuania 🇱🇹 -> 4.25%
91. Mauritius 🇲🇺 -> 4.25%
92. Fiji 🇫🇯 -> 4.25%
93. Mali 🇲🇱 -> 4.18%
94. Russia 🇷🇺 -> 4.16%
95. Togo 🇹🇬 -> 4.14%
96. India 🇮🇳 -> 4.10%
97. Croatia 🇭🇷 -> 4.09%
98. Niger 🇳🇪 -> 4.07%
99. Zambia 🇿🇲 -> 4.07%
100. Italy 🇮🇹 -> 4.07%
101. Mexico 🇲🇽 -> 4.06%
102. Kenya 🇰🇪 -> 4.02%
103. Georgia 🇬🇪 -> 3.98%
104. Philippines 🇵🇭 -> 3.97%
105. China 🇨🇳 -> 3.90%
106. United Arab Emirates 🇦🇪 -> 3.89%
107. St Lucia 🇱🇨 -> 3.85%
108. Hungary 🇭🇺 -> 3.80%
109. Dominican Republic 🇩🇴 -> 3.76%
110. Djibouti 🇩🇯 -> 3.75%
111. Luxembourg 🇱🇺 -> 3.74%
112. Ecuador 🇪🇨 -> 3.69%
113. Nepal 🇳🇵 -> 3.69%
114. Azerbaijan 🇦🇿 -> 3.66%
115. Ivory Coast 🇨🇮 -> 3.61%
116. Barbados 🇧🇧 -> 3.56%
117. Paraguay 🇵🇾 -> 3.53%
118. Malaysia 🇲🇾 -> 3.51%
119. St Kitts and Nevis 🇰🇳 -> 3.50%
120. Palau 🇵🇼 -> 3.44%
121. Serbia 🇷🇸 -> 3.40%
122. Greece 🇬🇷 -> 3.38%
123. Republic of Congo 🇨🇬 -> 3.34%
124. Japan 🇯🇵 -> 3.34%
125. El Salvador 🇸🇻 -> 3.32%
126. Romania 🇷🇴 -> 3.28%
127. Bosnia-Herzegovina 🇧🇦 -> 3.25%
128. Qatar 🇶🇦 -> 3.23%
129. Trinidad & Tobago 🇹🇹 -> 3.23%
130. Jordan 🇯🇴 -> 3.23%
131. Benin 🇧🇯 -> 3.23%
132. Chad 🇹🇩 -> 3.20%
133. Tanzania 🇹🇿 -> 3.16%
134. Antigua and Barbuda 🇦🇬 -> 3.11%
135. Turkey 🇹🇷 -> 3.10%
136. Albania 🇦🇱 -> 3.09%
137. Guatemala 🇬🇹 -> 3.08%
138. Madagascar 🇲🇬 -> 3.05%
139. Ghana 🇬🇭 -> 2.91%
140. Ireland 🇮🇪 -> 2.90%
141. San Marino 🇸🇲 -> 2.90%
142. Vietnam 🇻🇳 -> 2.89%
143. Nicaragua 🇳🇮 -> 2.87%
144. Suriname 🇸🇷 -> 2.87%
145. DR Congo 🇨🇩 -> 2.84%
146. Cameroon 🇨🇲 -> 2.84%
147. Iran 🇮🇷 -> 2.82%
148. Gambia 🇬🇲 -> 2.81%
149. Malawi 🇲🇼 -> 2.75%
150. Bahamas 🇧🇸 -> 2.74%
151. Sierra Leone 🇸🇱 -> 2.62%

152. Uganda 🇺🇬 -> 2.56%
153. Thailand 🇹🇭 -> 2.52%
154. Angola 🇦🇴 -> 2.51%
155. Panama 🇵🇦 -> 2.47%
156. Armenia 🇦🇲 -> 2.44%
157. Comoros 🇰🇲 -> 2.34%
158. Gabon 🇬🇦 -> 2.32%
159. Ethiopia 🇪🇹 -> 2.30%
160. Liberia 🇱🇷 -> 2.27%
161. Singapore 🇸🇬 -> 2.19%
162. Cambodia 🇰🇭 -> 2.18%
163. Bangladesh 🇧🇩 -> 2.03%
164. Myanmar 🇲🇲 -> 2.00%
165. Pakistan 🇵🇰 -> 1.95%
166. Andorra 🇦🇩 -> 1.90%
167. Bahrain 🇧🇭 -> 1.89%
168. Central African Republic 🇨🇫 -> 1.83%
169. Sri Lanka 🇱🇰 -> 1.83%
170. Monaco 🇲🇨 -> 1.73%
171. Guinea 🇬🇳 -> 1.72%
172. South Sudan 🇸🇸 -> 1.57%
173. Indonesia 🇮🇩 -> 1.28%
174. Laos 🇱🇦 -> 1.23%
175. Lebanon 🇱🇧 -> 1.22%
176. Haiti 🇭🇹 -> 0.96%
177. Papua New Guinea 🇵🇬 -> 0.78%
178. Zimbabwe 🇿🇼 -> 0.38%
179. Nigeria 🇳🇬 -> 0.32%
180. Somalia 🇸🇴 -> 0.0000081%

Immigrant population in Montenegro 🇲🇪, 2010-2024
Source = Migration Policy Institute and Macrotrends
2010 -> 78,512
2015 -> 71,719
2020 -> 70,999
2024 -> 92,237

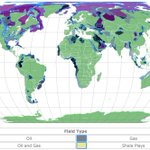
Field Production of Crude Oil in Nevada 🇺🇸, 1981-2025
In Barrels Per Day (BPD)
Source = U.S. Energy Information Administration
1981 -> 700,000 BPD
1985 -> 3.03 Million BPD
1990 -> 4.01 Million BPD
1995 -> 1.34 Million BPD
2000 -> 621,000 BPD
2005 -> 447,000 BPD
2010 -> 426,000 BPD
2015 -> 281,000 BPD
2020 -> 221,000 BPD
2025 -> 172,000 BPD

Share of Dominance of Credit Rating Agencies in Credit Rating Market 💳, 2024
Source = Visual Capitalist
01. S&P Global Ratings 🇺🇸 -> 49.60%
02. Moody's Ratings 🇺🇸 -> 31.40%
03. Fitch Ratings 🇺🇸 -> 12.40%
04. Morningstar DBRS 🇨🇦 -> 3.10%
05. KBRA 🇺🇸 -> 2.10%
06. Egan-Jones Ratings Company 🇺🇸 -> 0.66%
07. AM Best 🇺🇸 -> 0.39%
08. Japan Credit Rating Agency 🇯🇵 -> 0.24%
09. HR Ratings 🇲🇽 -> 0.10%
10. Demotech 🇺🇸 -> 0.02%

Immigrant population in Albania 🇦🇱, 1960-2024
Source = Migration Policy Institute and Macrotrends
1960 -> 49,000
1970 -> 54,000
1980 -> 60,000
1990 -> 66,013
1995 -> 71,354
2000 -> 76,695
2005 -> 64,739
2010 -> 52,784
2015 -> 52,031
2020 -> 48,810
2024 -> 46,377

Top 75 Largest Pickle Importing Nations 🥒, 2025
Source = World's Top Exports
01. Germany 🇩🇪 -> 126.28 Million US$
02. United States 🇺🇸 -> 122.66 Million US$
03. Canada 🇨🇦 -> 103.33 Million US$
04. United Kingdom 🇬🇧 -> 70.49 Million US$
05. Netherlands 🇳🇱 -> 48.76 Million US$
06. France 🇫🇷 -> 47.43 Million US$
07. Czech Republic 🇨🇿 -> 33.53 Million US$
08. Belgium 🇧🇪 -> 33.18 Million US$
09. Poland 🇵🇱 -> 25.59 Million US$
10. Spain 🇪🇸 -> 25.40 Million US$
11. Russia 🇷🇺 -> 25.38 Million US$
12. Austria 🇦🇹 -> 23.86 Million US$
13. Australia 🇦🇺 -> 22.36 Million US$
14. Romania 🇷🇴 -> 20.97 Million US$
15. Switzerland 🇨🇭 -> 20.50 Million US$
16. Denmark 🇩🇰 -> 17.36 Million US$
17. Mexico 🇲🇽 -> 16.42 Million US$
18. Italy 🇮🇹 -> 16.24 Million US$
19. Hungary 🇭🇺 -> 14.71 Million US$
20. Bulgaria 🇧🇬 -> 14.00 Million US$
21. Sweden 🇸🇪 -> 12.51 Million US$
22. China 🇨🇳 -> 12.50 Million US$
23. Lithuania 🇱🇹 -> 11.93 Million US$
24. Finland 🇫🇮 -> 11.45 Million US$
25. South Korea 🇰🇷 -> 10.61 Million US$
26. Slovakia 🇸🇰 -> 10.58 Million US$
27. Kazakhstan 🇰🇿 -> 10.26 Million US$
28. Latvia 🇱🇻 -> 8.71 Million US$
29. Japan 🇯🇵 -> 8.57 Million US$
30. Saudi Arabia 🇸🇦 -> 8.54 Million US$
31. Serbia 🇷🇸 -> 8.37 Million US$
32. Ireland 🇮🇪 -> 7.08 Million US$
33. Slovenia 🇸🇮 -> 6.58 Million US$
34. Mongolia 🇲🇳 -> 6.44 Million US$
35. Chile 🇨🇱 -> 5.82 Million US$
36. New Zealand 🇳🇿 -> 5.36 Million US$
37. Georgia 🇬🇪 -> 5.35 Million US$
38. Palestine 🇵🇸 -> 4.59 Million US$
39. Israel 🇮🇱 -> 4.53 Million US$
40. Croatia 🇭🇷 -> 4.52 Million US$
41. Iraq 🇮🇶 -> 4.46 Million US$
42. Portugal 🇵🇹 -> 4.44 Million US$
43. Brazil 🇧🇷 -> 4.36 Million US$
44. Estonia 🇪🇪 -> 4.24 Million US$
45. Greece 🇬🇷 -> 3.77 Million US$
46. Belarus 🇧🇾 -> 3.60 Million US$
47. United Arab Emirates 🇦🇪 -> 3.51 Million US$
48. South Africa 🇿🇦 -> 3.20 Million US$
49. Bosnia-Herzegovina 🇧🇦 -> 2.55 Million US$
50. Ukraine 🇺🇦 -> 2.37 Million US$
51. Costa Rica 🇨🇷 -> 2.25 Million US$
52. Argentina 🇦🇷 -> 2.06 Million US$
53. Luxembourg 🇱🇺 -> 2.01 Million US$
54. Colombia 🇨🇴 -> 1.79 Million US$
55. Malaysia 🇲🇾 -> 1.78 Million US$
56. Norway 🇳🇴 -> 1.69 Million US$
57. El Salvador 🇸🇻 -> 1.68 Million US$
58. Armenia 🇦🇲 -> 1.63 Million US$
59. Taiwan 🇹🇼 -> 1.60 Million US$
60. Montenegro 🇲🇪 -> 1.58 Million US$
61. Azerbaijan 🇦🇿 -> 1.52 Million US$
62. Philippines 🇵🇭 -> 1.40 Million US$
63. Kuwait 🇰🇼 -> 1.38 Million US$
64. Panama 🇵🇦 -> 1.37 Million US$
65. Morocco 🇲🇦 -> 1.25 Million US$
66. Singapore 🇸🇬 -> 1.21 Million US$
67. Oman 🇴🇲 -> 1.18 Million US$
68. Iceland 🇮🇸 -> 1.08 Million US$
69. Paraguay 🇵🇾 -> 1.04 Million US$
70. Guatemala 🇬🇹 -> 946,000 US$
71. Jordan 🇯🇴 -> 910,000 US$
72. Cyprus 🇨🇾 -> 893,000 US$
73. Kyrgyzstan 🇰🇬 -> 827,000 US$
74. Dominican Republic 🇩🇴 -> 789,000 US$
75. Indonesia 🇮🇩 -> 673,000 US$

Top 10 Fastest Growing Cities in United States 🇺🇸, 2022-2024
Source = Visual Capitalist
01. Miami -> 5.10%
02. Houston -> 4.31%
03. Charlotte -> 4.26%
04. Columbus -> 3.97%
05. Jacksonville -> 3.68%
06. Orlando -> 3.48%
07. Tampa -> 3.37%
08. San Jose -> 3.17%
09. Boston -> 2.89%
10. Dallas–Fort Worth -> 2.36%

Nations home to Natural Habitat of River Shark 🦈
Source = Fish Base, Citrus Reef, I Naturalist and Shark Sider
01. Pakistan 🇵🇰, India 🇮🇳, Bangladesh 🇧🇩, Myanmar 🇲🇲 and Malaysia 🇲🇾 -> Ganges Shark
02. Indonesia 🇮🇩 -> Speartooth and Ganges Shark
03. Australia 🇦🇺 -> Northern River and Speartooth Shark

Immigrant population in North Macedonia 🇲🇰, 1990-2024
Source = Migration Policy Institute and Macrotrends
1990 -> 95,142
1995 -> 109,343
2000 -> 125,665
2005 -> 127,667
2010 -> 129,701
2015 -> 130,730
2020 -> 131,311
2024 -> 150,902

Top 10 Nations from where China Imported Rice 🌾, 2025
Source = World's Top Exports
01. Myanmar 🇲🇲 -> 400.49 Million US$
02. Vietnam 🇻🇳 -> 362.85 Million US$
03. Thailand 🇹🇭 -> 358.87 Million US$
04. Cambodia 🇰🇭 -> 119.04 Million US$
05. India 🇮🇳 -> 114.04 Million US$
06. Pakistan 🇵🇰 -> 62.26 Million US$
07. Laos 🇱🇦 -> 19.14 Million US$
08. South Korea 🇰🇷 -> 400,000 US$
09. Japan 🇯🇵 -> 297,000 US$
10. Italy 🇮🇹 -> 276,000 US$

Top 15 Nations that Borrowed Most from International Monetary Fund 💰, 2026
Source = Visual Capitalist
01. Argentina 🇦🇷 -> 56.8 Billion US$
02. Ukraine 🇺🇦 -> 14.4 Billion US$
03. Pakistan 🇵🇰 -> 10.8 Billion US$
04. Egypt 🇪🇬 -> 10.6 Billion US$
05. Ecuador 🇪🇨 -> 9.4 Billion US$
06. Ivory Coast 🇨🇮 -> 5.6 Billion US$
07. Ghana 🇬🇭 -> 4.0 Billion US$
08. Bangladesh 🇧🇩 -> 3.9 Billion US$
09. Kenya 🇰🇪 -> 3.8 Billion US$
10. DR Congo 🇨🇩 -> 3.3 Billion US$
11. Sri Lanka 🇱🇰 -> 3.0 Billion US$
12. Angola 🇦🇴 -> 2.9 Billion US$
13. Ethiopia 🇪🇹 -> 2.8 Billion US$
14. Costa Rica 🇨🇷 -> 2.4 Billion US$
15. Jordan 🇯🇴 -> 2.3 Billion US$

Immigrant population in Bulgaria 🇧🇬, 1960-2024
Source = Migration Policy Institute and Macrotrends
1960 -> 20,000
1970 -> 21,000
1980 -> 22,000
1990 -> 21,510
1995 -> 32,435
2000 -> 43,360
2005 -> 61,074
2010 -> 76,287
2015 -> 123,803
2020 -> 184,363
2024 -> 299,100

🇺🇸🗳️ Voting Pattern of Maine and it's Result in Every Presidential Election in 21st Century, 2000-2024
Source = Maine Secretary of State
● 2000 Presidential Election -> 🔵 Democratic Victory (49.09%)
● 2004 Presidential Election -> 🔵 Democratic Victory (53.57%)
● 2008 Presidential Election -> 🔵 Democratic Victory (57.71%)
● 2012 Presidential Election -> 🔵 Democratic Victory (56.27%)
● 2016 Presidential Election -> 🔵 Democratic Victory (47.83%)
● 2020 Presidential Election -> 🔵 Democratic Victory (53.09%)
● 2024 Presidential Election -> 🔵 Democratic Victory (52.40%)
Top 13 Largest Beer Brewing Nations 🍺, 2025
Source = Visual Capitalist
01. China 🇨🇳 -> 9.34 Billion Gallons
02. United States 🇺🇸 -> 4.62 Billion Gallons
03. Brazil 🇧🇷 -> 3.99 Billion Gallons
04. Mexico 🇲🇽 -> 3.90 Billion Gallons
05. Russia 🇷🇺 -> 2.38 Billion Gallons
06. Germany 🇩🇪 -> 2.09 Billion Gallons
07. Vietnam 🇻🇳 -> 1.14 Billion Gallons
08. Japan 🇯🇵 -> 1.14 Billion Gallons
09. Spain 🇪🇸 -> 1.08 Billion Gallons
10. United Kingdom 🇬🇧 -> 1.02 Billion Gallons
11. South Africa 🇿🇦 -> 1.00 Billion Gallons
12. India 🇮🇳 -> 926.20 Million Gallons
13. Poland 🇵🇱 -> 848.50 Million Gallons
