

Map design at @mapbox • Maps of Madison WI + beyond via @latlong_shop 🗺️🏳️🌈
- Tweets2.3K
- Following1.3K
- Followers1.2K
- Likes5.1K
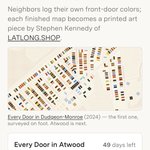






ALT Screenshot of the Every Door landing page. Headline reads 'A map of every front door in Madison,' with an explanation that neighbors log their own front-door colors to create printed map art by Stephen Kennedy of LATLONG.SHOP. Below is a colorful sample map of the Dudgeon-Monroe neighborhood, showing rows of small door-shaped icons in varied colors along street blocks. A progress card shows 'Every Door in Atwood,' 49 days left, and 381 of 2,229 front doors logged (17%), with a progress bar. A black 'Start surveying Atwood' button sits at the bottom."

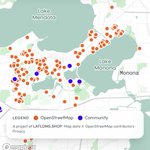
ALT Screenshot of the Every Door in Atwood map interface on mobile. A header bar shows the neighborhood name, an 'Unsurveyed only' toggle, the logged-door count and percentage, days remaining, and a progress bar. Below it is an address search field. The map shows a residential street grid with colored dots marking surveyed doors — browns, blacks, reds, blues, yellows, and greens — alongside hollow white circles marking homes not yet surveyed. Street labels include Atwood Avenue, Eastwood Drive, Sommers Avenue, Dunning Street, Center Avenue, and Oakridge Avenue. Map zoom and location controls appear in the bottom right corner.


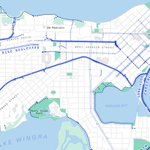
ALT A stylized bike map of Madison, Wisconsin, highlighting cycling infrastructure throughout the city. Key bike routes are displayed in varying shades and patterns of blue: solid lines for permitted and off-street routes, dotted lines for signed routes, darker dashed lines for protected lanes, and lighter dashed lines for shared lanes. The map prominently features Lake Mendota at the top and Lake Monona near the center, with key bike trails like the Southwest Path, Capital City Trail, and Lake Loop marked. Green areas indicate parks, and the city's street network is visible in the background. The map is titled "Bike Map of Madison" with a legend in the top-left corner. Created by LatLong.shop, with sources from OpenStreetMap and the City of Madison.


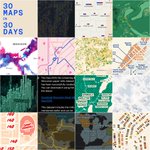
ALT A nighttime-themed map of Wisconsin titled "Churches & Bars" shows the distribution of churches and bars across the state. Churches are represented by blue dots, while bars are shown as red dots. Key cities such as Milwaukee, Madison, Green Bay, Appleton, Oshkosh, Fond du Lac, and Stevens Point are labeled, with clusters of dots concentrated around urban areas. The map highlights heavy concentrations of both churches and bars in Milwaukee and Madison, with smaller clusters in Green Bay and along Lake Michigan. The map is designed with a dark blue background and neon-like text and dots, giving it a striking, modern appearance. Sources include Overture Maps Foundation, and the map is credited to Stephen Kennedy as part of the #30DayMapChallenge.


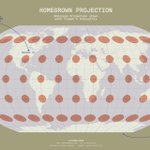
ALT This image is a visualization of the Robinson map projection titled “Homegrown Projection.” It features a world map with Tissot’s indicatrix—small orange ellipses—overlaid to show distortion. Key features are highlighted with annotations: 1. Top left: “Devised by Arthur H. Robinson in 1963 while a professor at UW-Madison” with an arrow pointing to “Madison, WI” on the map. 2. Bottom left: “Compromised distortion of area and angles (neither equal-area nor conformal).” 3. Bottom right: “Severe distortion at the poles, which are shown as lines rather than points.” 4. Top right: “Adopted by the National Geographic Society for general-purpose world maps from 1988 to 1998.” The map has a beige background with light blue grid lines and a subtle 3D effect on the globe. Text at the bottom credits LATLONG.SHOP, mentions #30DayMapChallenge (Day 26: Projection), and notes the use of Natural Earth Data.


ALT Infographic of Wisconsin with a grid of circles going from dark brown to bright white. The brighter the circle, the higher the density of cattle in that area, based on a 10km resolution raster dataset converted into a point grid for each cell in the raster image.


