






Pinned Tweet
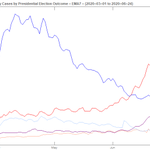
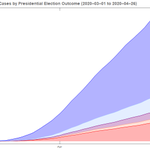
More #covidstats: In the US, Republican states are ~44% of the pop, ~56% for Democratic states.
The state-level breakdown of #COVID19 cases skews 20% Red, 80% Blue.
Sadly, this is yet another way each side lives the #pandemic differently, from liberation to lockdown.

@flightradar24 any ideas what happened to this flight and why it’s diverting to Orlando?
fr24.com/18.42,-66.14/10

Paul retweeted

a “military target” in kyiv hit by russian rockets.
sure looks like an apartment building to me…


Sure, this is a canned demo but still really impressive vision of what GPT like automatic code gen could one day become.
A company could train one on its codebase and give each dev a silicon pair programmer
m.youtube.com/watch?v=fZSFNU…


Paul retweeted

Europe map showing a new political alignment: Sweden, UK and Russia with a few Eastern block countries? Nope
These are "Winners" in Green, "Nearly There" in Yellow, "Take Action" in Red. Confinement is possible, root for Green!
Norway just became a Winner! Congratulations!

The most uplifting read in a long while. Should be added to every Lord of the Flies book. There is hope for humanity after all!
theguardian.com/books/2020/m…

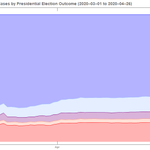
What most surprised me in this chart is how stable the proportions are throughout April. Will be interesting to see if / how this changes as some states relax lockdowns before others.

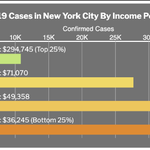
Wealthiest 25% of New Yorkers account for 10% of cases. Lots more #covidstats on the #covid19's disparities and impact on the disadvantaged in the latest FLARE newsletter mailchi.mp/f92fac59d07c/tz4i…

New #covidstats: Cases per capita in US states vs. level of urbanization. Some correlation of higher densities == more #COVID19 spread but other factors at play too
(Urbanization levels from 2010 US Census via Wikipedia)


Been exploring #covidstats. Here are log plots of day over day case growth.
#USA & #Italy: Down to linear growth recently 👍
#Singapore: Surprisingly, exponential. Why they went into lockdown mode 😷
#NewZealand: Impressive! 👏
(Data as of 4/16)

But #covid19 deaths in those countries show a different story altogether: Minimal in #Singapore and #NewZealand, slowing in #Italy, not out of the woods in #USA 😢


