

Products ∪ Data ∪ Systems | Created heatmap.js @pa7@vis.social
San Francisco, CA
Joined October 2010
- Tweets1.4K
- Following298
- Followers956
- Likes2.7K




Patrick Wied retweeted

Take a look into the mind of the machine! visit my new project here: moebio.com/mind/
I repeated the same completion prompt "Intelligence is " hundreds of times and used this to peer into the statistical and semantic behavior of chatgpt
Patrick Wied retweeted

It's #SuperTuesday! 🗳️ After months of hard work, we're thrilled to unveil this year's election coverage at @AP. Dive into our newly designed maps, timelines, tables, and more to stay updated.
Your go-to source for #Election2024 details! 👀Check it out: apnews.com/projects/election…


Patrick Wied retweeted

Fun online interactive tool to play (procrastinate, really) with pathfinding algorithms on a real map anywhere in the world honzaap.github.io/Pathfindin… #routing #transportnetworks
Patrick Wied retweeted
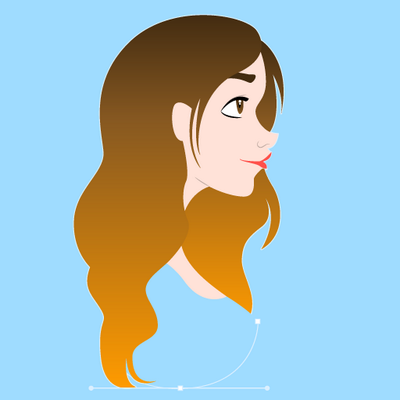
Our latest visual story explains how Generative AI works, what are transformers and why “large language models” are such incredible tools.
Done with this awesome team @Dan_Clark5
@sam_learner @samjoiner @madhumita29 @olihawkins and @EadeMoon!
👉 ig.ft.com/generative-ai/
Patrick Wied retweeted

20 years ago today, a Hall of Fame bit of Internet lore dropped. youtu.be/NL6CDFn2i3I?si=dqU5…

Patrick Wied retweeted

Mosaic looks really great! Great to see a viz library thread down to the db level. DuckDB is such a natural choice for something like this.
uwdata.github.io/mosaic/
Patrick Wied retweeted
Your favorite TV Show ended years ago and was not renewed? :(
Wouldn't it be cool if we could get just one more episode?
That's why I built a website with screenplays of popular TV Shows that don't exist (written with help by GPT-4).
Can you hear the characters in your mind?

ALT a screenshots of the "More Episodes!" website showing popular tv shows like "Crazy Ex-Girlfriend", "The Wire", "Buffy", "Derry Girls", "Firefly", "Simpsons".
Patrick Wied retweeted

when my best friend & I were 5 & 6 yrs old my mom asked us what we thought the meaning of life was & we determined it was "to have fun & take care of each other." this is still correct
Patrick Wied retweeted

How close does a double pendulum gets to its initial condition? Here's all initial positions starting from rest, visualized at once.
Brightness is how close in phase space (Euclidean distance) a setup gets.
More details and higher resolution on YouTube:
youtube.com/watch?v=iaP62Lr8…


Patrick Wied retweeted

@observablehq now has an official @duckdb (WASM) client based on our work @cmudig with @ankohn and @duckdblabs. 🎉 observablehq.com/@observable…
I think there is no easier and faster way to analyze large datasets in the browser. Take it for a spin and make some pretty charts! 🏎️📊💻

Patrick Wied retweeted

An attempt at understanding the context and picking the right tool for the job: Validation Quads v0.9.
Partial explainer: robfitz.com/c/writing/custom…

Patrick Wied retweeted

📜 Announcing Chartability, an extensive set of heuristics for evaluating visualization accessibility!
✍️ @FrankElavsky, @clb5590, @domoritz
👉 frank.computer/chartability/
#FullPaper #EuroVis #EuroVis2022

ALT An interactive chart being focused by a screen reader and displaying only “Image” as semantic information. No feedback is provided on selection. The robust semantics given to a screen reader, “toggle button” (middle) as well as instant feedback on the button's state, “selected” (right) are considered good semantics for an interactive experience.


Patrick Wied retweeted

I am the kind of person who can easily work 14 hours without noticing, it took me ages to figure out just because I can, doesn’t mean that I should.
I’ve been scheduling breaks and not overworking lately and every part of my life is better. Including my work!

.@NetflixEng Dir. of Dev Productivity Engineering Kathryn Koehler says that no good happens after 45 hrs of work in a week. Seeing as its her job to engineer productivity, we would take her word for it 💪
Don't burn out + give your best work by perfecting your work life balance
Patrick Wied retweeted

There's more to alt text than just labeling a graph, "Graph." Learn how to make your charts, graphs, and other detailed graphics more accessible to everyone.
equidox.co/blog/beyond-basic…
#accessibility #a11y #AltText #DigitalAccessibility