

Democratizing access to the Nobel Prize-winning science of portfolio optimization. Free Web #API available at https://xitter.cf/t.co/Sc4wrvf02k.
France
Joined July 2021
- Tweets897
- Following136
- Followers950
- Likes1K






New blog post on log-linear regression for analyzing long-term asset prices -> portfoliooptimizer.io/blog/t…
In it, some mathematical background on log-linear regression and geometric Brownian motion plus the study of a mean-reversion trading strategy for individual stocks.

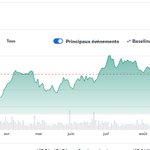
I recently bumped into an article showing - using Shiller data - that the inflation-adjusted S&P Composite is way overvalued v.s. historical norms (top figure).
When including dividends, though, the conclusion is materially different (bottom figure)...
Total return matters!

A blog post on the associated methodology and pitfalls (ex., the look-ahead present in this type of chart) will follow soon.
Link to the article from @Vetta_Fi -> advisorperspectives.com/dsho…

New API endpoints to compute:
- The Binary Bias Measure (BBM), a momentum-like asset indicator
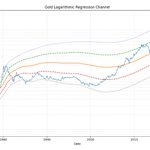
- The logarithmic regression channel, which is a linear regression-based transformation of an asset prices, typically used for long-term growth analysis
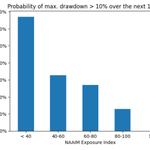
New blog post on the NAAIM Exposure Index as a continuation indicator -> portfoliooptimizer.io/blog/t…
As an example of usage, I show show how to extract probabilities of drawdown over the next 12 weeks for the U.S. stock market from the values of the NAAIM Exposure Index.

New blog post on Tom Carlson's "Adaptive 60/40 Portfolio" -> portfoliooptimizer.io/blog/t…
In this blog post, I analyze that trading strategy (rationale, performances) and I propose a variation based on the Probabilistic Sharpe Ratio to weight momentum signals.

To be noted that this strategy (the original one) can be followed live on BestFolio -> bestfolio.app/landing (no affiliation)
This is a work in progress on my side, but analyzing the NAAIM data over its full sample (> 1000 weeks) leads to the conclusion that the higher the reading, the more bullish for US stocks.
So, readings of 100+ are actually max bullish, or at least were in the past.


The NAAIM Exposure Index survey tells you how invested active managers are, week to week. Readings above 100 mean leveraged long, or more than fully invested.
This has been known to be a good contrarian indicator. Perhaps this image explains why.
When you overlay readings of 100 or greater onto the SPX, the extreme bullishness is not subtle. This small sample set shows that asset managers got most bullish (100% long or leveraged long) right before turning points in the market.
Current NAAIM reading is 102.66.
Question now is, is this time different?

New Portfolio Optimizer Web API endpoint to compute the price-path convexity of an asset.
Reference -> cambridge.org/core/journals/…

New blog post on the Sharpe Stability Ratio -> portfoliooptimizer.io/blog/t…
That measure captures the temporal stability of the mean rolling Sharpe Ratio of an investment.
In this post, I describe it in details, compare it to the Sharpe Ratio and the Ulcer Performance Index and...

2 new "Sharpe Ratio"-related endpoints on Portfolio Optimizer Web API that enable to compute:
- A portfolio rolling Sharpe Ratios
- A portfolio Sharpe Stability Ratio, which evaluates the temporal consistency of a portfolio Sharpe Ratio recently introduced in Traver and Domínguez
Link to Traver and Domínguez paper -> papers.ssrn.com/sol3/papers.…
Dans son livre "Cessez de vous faire avoir", Charles Gave décrit son cadre d'analyse économique en 4 cadrants (croissance/inflation) et son utilisation pour gérer un portefeuille.
J'ai créé une page qui affiche les données associée en live (US) ->
portfoliooptimizer.io/macro-…

En espérant que cela puisse aider certains à appliquer les méthodes de tonton Charles :-) !
Voici d'ailleurs la dernière vidéo de Charles sur le sujet -> youtube.com/watch?v=aaxi-HCO…

And... it was actually quicker than anticipated, but a live page with Charles Gave Four Quadrants is available there -> portfoliooptimizer.io/macro-…
Example of historical macro chart:

New Portfolio Optimizer Web API endpoints to retrieve 2 market indicators that could be called:
- The Energy Efficiency Indicator
- The Currency Debasement Indicator
These are based on Charles Gave's (ping @IdLiibertes) book "The General Theory of Portfolio Construction".
Together, they (tentatively) allow to map in which quadrant of the Four Quadrant Growth/Inflation matrix the economy is at a given point in time.
Currently, for the U.S. economy:
