
computational biophysicist; professor of physics & grad program director at Wake Forest University; EiC, Journal of Biomolecular Structure & Dynamics.
- Tweets14.6K
- Following2K
- Followers1.5K
- Likes18.1K



ALT Dark charcoal and gold JBSD infographic with a rice plant and a labeled conceptual schematic of OsCobB plus NAD+ removing an acyl tag from an H3K9 peptide. Apparent catalytic efficiencies with NAD+ varied are 652 for glutaryl, 206 for succinyl and 118 for malonyl removal, in M⁻¹ s⁻¹ (Table 1; n = 3). Gold and teal distinguish the modifications. Glutaryl removal is most efficient among these tested acidic modifications.

ALT Dark charcoal and gold JBSD infographic. A labeled model schematic feeds apo residue descriptors into Apo-Holo and branches to backbone and side-chain mobility predictions. The dataset contains 33 apo–holo pairs and 19,891 residue instances. Reported internal classification recall is 0.8262 for backbone and 0.8570 for side chains. Recall is the fraction of observed mobile residues identified. Gold and teal distinguish the outputs. Source: Santiago Alonso-Gil, Figure 1 and Table 3.

ALT Dark charcoal and gold JBSD infographic. A labeled screening and assay schematic sends compound tokens through sievgene, DOCK 6 and AutoDock Vina to five assay wells. One gold well identifies compound 6, which inhibited human D-amino acid oxidase. The screen began with 160,000 compounds; five candidates were tested. Reported IC50: 440 ± 110 µM, with three to four independent experiments per concentration. Source: Yusuke Kato and Kiyoshi Fukui, Figures 2 and 6.

ALT Dark charcoal and gold JBSD infographic with a labeled model schematic. The first 35 and last 35 mRNA nucleotides feed ESM2, MMDO-MDPU resampling and a two-stage ensemble that predicts nine location labels. Reported Coverage is 0.9144 for EMMPREDMLsub and 0.6584 for MBSCLoc in the RNALocate comparison. Coverage is the mean fraction of known location labels recovered per sample. Gold and teal distinguish the values. Source: Luo and colleagues, Figures 1 and 8.

ALT Dark charcoal and gold JBSD infographic with a labeled assay schematic. An abstract Q1 disc branches to gold PTP1B and teal SHP2 assay plates. At 50 µM Q1, inhibition is 99.70 ± 0.05% for PTP1B and 35.26 ± 0.78% for SHP2. A lower callout gives PTP1B IC50 of 2.45 ± 0.04 µM. Source: Cao, Zhao, Zhang and Wang, Jiangnan University, Table 2.

ALT Dark charcoal and gold JBSD infographic with a labeled method schematic. Data from 35 thiazole derivatives, split into 27 training and eight test compounds, branch into HQSAR molecular-fragment and CoMSIA steric, electrostatic and hydrophobic-field models. Their maps guide nine new designs. External test-set R² is 0.817 for CoMSIA and 0.700 for HQSAR. Gold and teal distinguish the abstract model elements. Source: Zaki and colleagues, Tables 4–5 and Figure 6/Table 7.


ALT Dark charcoal and gold JBSD infographic with a labeled TSR method schematic. Three abstract points form a triangle, leading to layered geometric keys and a branching shape-comparison tree. Five benchmark datasets each contain seven classes and 20 structures per class. TSR outperforms RMSD, USR and ROSHAMBO and is slightly ahead of Phase in this comparison. Teal distinguishes schematic elements. Source: Reaux et al., Methods, Section 3.6 and Figure 10.

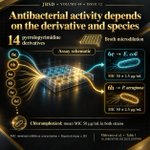
ALT Dark charcoal and gold JBSD infographic with a labeled assay schematic: pyrrolopyrimidine derivatives flow into a broth microdilution plate and two bacterial assay callouts. Compound 6e inhibits E. coli and compound 6h inhibits P. aeruginosa, each at a reported MIC of 50 ± 2.5 µg/mL (mean ± SD). Chloramphenicol has a mean MIC of 50 µg/mL in both strains. The study tested 14 derivatives. Bacteria and plate are conceptual illustrations. Source: Makwana et al., Table 1.

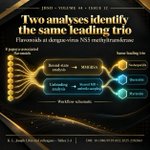
ALT Dark charcoal and gold JBSD infographic. A labeled workflow schematic splits eight papaya-associated flavonoids into bound-state MMGBSA analysis and unbinding analysis using steered molecular dynamics and umbrella sampling. Both routes lead to the same top three: neohesperidin, quercetin and myricetin, in that order. The study targets dengue-virus NS5 methyltransferase. Source: K. L. Joseph Libin and colleagues, Tables 2 and 3.

ALT Dark charcoal and gold JBSD infographic. A labeled screening schematic connects UM-4E in gold and UM-C162 in teal to Hla, SrtA, AgrA and SspA. UM-4E leads the mean docking scores across these four Staphylococcus aureus targets. Hla mean docking binding energies are −9.70 for UM-4E, −7.54 for UM-C162, −5.94 for curcumin and −5.17 for ACA, all in kcal/mol. The study used 100 docking runs per ligand–target pair. Source: Al Quwatli and colleagues, Figure 7.

ALT Dark-and-gold JBSD infographic with a labeled study schematic linking keratinase kerC to three solvent conditions. Mean radius of gyration over 100–200 ns was approximately 2.06 nm in [AMIM]Cl, close to 2.09 nm in water, and 2.49 nm in [BMIM]Br. Ionic liquids were at 0.5 M in 200 ns simulations. Gold, white and teal distinguish the conditions. Rai and Hasija, Volume 44, Issue 12; Section 3.2.5.1 and Figure 12.

ALT Black-and-gold JBSD infographic with a labeled ranking schematic. A geometric Bitopertin node branches to DAT, ECR 1.382, in gold and GlyT1, ECR 0.794, in teal. Bitopertin scores higher for DAT than GlyT1. Two smaller annotations identify NFPS_2 as first for GlyT1 at ECR 1.896 and Org 24598_2 as first for GlyT2 at ECR 1.075. ECR combines ranks from AutoDock Vina, GOLD and DockThor. Source: Nascimento and colleagues, Section 3.3 and Figure 4.

ALT Black-and-gold JBSD infographic with a labeled study-workflow schematic. A screen of 158 missense variants leads to W474C and W485R. Both variants and a separate native HEXA reference enter 500 ns molecular dynamics analysis with pyrimethamine. Reported average backbone RMSD values are approximately 0.230 nm for native, 0.224 nm for W474C and 0.264 nm for W485R. Average intermolecular hydrogen-bond counts are approximately 1.8, 3.8 and 2.2, respectively. Gold highlights show W485R has the highest average backbone RMSD and W474C the highest average hydrogen-bond count. Source: S. Ranjani et al., Table 12.

ALT Square JBSD infographic showing a conceptual Gwt1 pocket workflow that screens 9,390 compounds and identifies tivozanib and rosiglitazone. Their docking scores are −9.10 and −8.13 kcal/mol. A three-species MIC90 table lists tivozanib at 1 ± 0.5, 2 ± 1, and 1 ± 0.5 µg/mL, and rosiglitazone at 4 ± 1.5, 4 ± 2, and 1 ± 0.5 µg/mL, against C. neoformans, C. albicans, and A. fumigatus.


ALT Square black-and-gold JBSD infographic comparing five stilbenoids in an Aβ42 protofibril model. Colored curves connect each compound's docking-score rank on the left to its mean MM-PBSA binding-free-energy rank on the right. Rhapontigenin's gold curve rises from fifth to first: docking score −6.6 kcal/mol; computed MM-PBSA binding free energy −16.732 ± 5.807 kcal/mol. Piceid moves from first to third; astringin stays second; piceatannol moves from third to fourth; resveratrol moves from fourth to fifth. Labels reproduce the reported values and variation. Curves connect identities, not energy magnitudes; these computed rankings do not establish statistical separation. Based on the article's Tables 2 and 3.

ALT Square black-and-gold JBSD infographic about CBDPF for protein dephosphorylation-site prediction. A labeled computational-model schematic connects sequence windows, ProtT5, LoRA, a CNN, and site prediction. Gold labels identify CBDPF and turquoise labels identify fully fine-tuned ProtT5. Reported accuracy is 98.72% versus 97.98% on dbPTM S/T sites (Table 4), and 99.12% versus 98.43% on PhosphoSitePlus Y sites (Table 5). The schematic is adapted from Figure 1; no molecular structure is shown. Results are computational benchmarks, with no experimental test of phosphate removal.

ALT Square black-and-gold JBSD infographic for TCB-Kla. A peptide window centered on lysine feeds a Transformer encoder, multi-scale CNN, bidirectional LSTM, and fully connected classifier. Table 6 independent-test accuracy is 82.11% for the full model and 79.77% without the multi-scale CNN; full-model ROC AUC is 0.8983. The schematic is adapted from Figure 1. Authors: Shengli Zhang and Bin Sheng, Xidian University. DOI: 10.1080/07391102.2026.2645110.

ALT Black-and-gold JBSD infographic comparing three 100 ns simulations of raloxifene–STAT3. A labeled conceptual silhouette represents the complex, with gold, red, and teal annotations for the complex alone, metformin, and cisplatin. Reported Cα-RMSD ranges are 0.20–0.30, 0.20–0.45, and 0.10–0.25 nm, respectively. The schematic is not a molecular structure; the ranges are not confidence intervals. Experimental validation remains needed.